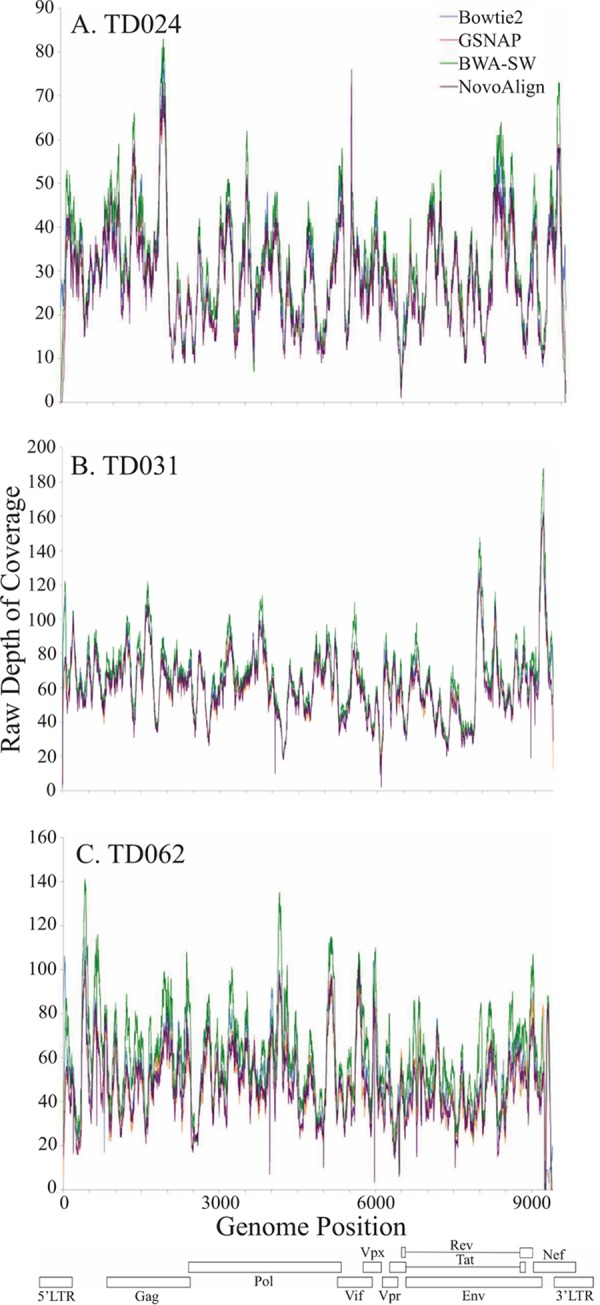
FIG 3.

Depth of coverage with the four different aligners. Depth of coverage for each locus was plotted for TD024 (A), TD031 (B), and TD062 (C). Open rectangles represent the locations of HIV-2 genes, and the position of the longest merged contig is also shown for each sample. Coverage plots are shown for each of the four aligners, Bowtie2, GSNP, BWA-SW, and NovoAlign. Coverage was plotted as raw depth, showing the number of reads mapping to each locus.
