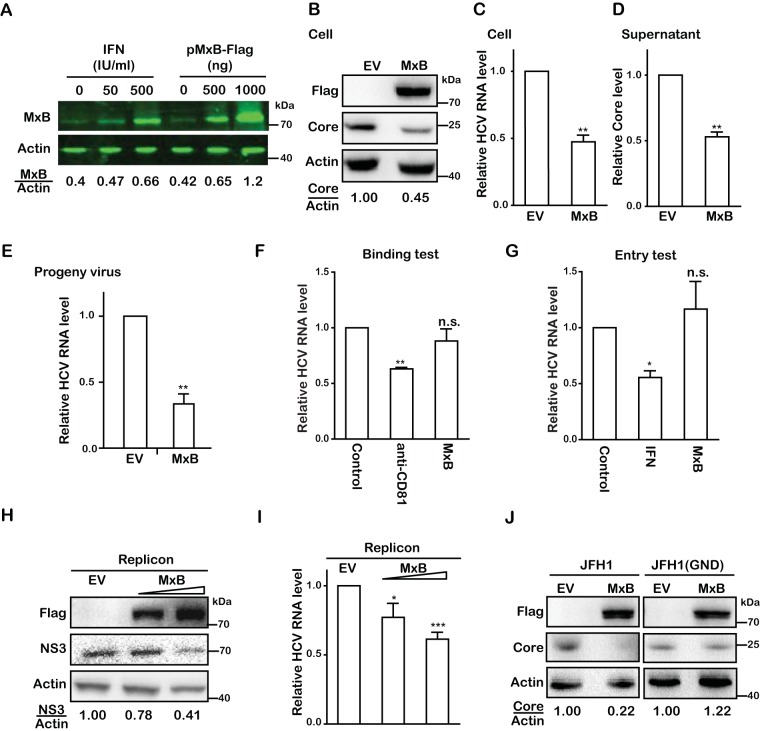
FIG 4.
MxB inhibits RNA replication of HCV. (A) Huh7.5.1 cells were either treated with IFN-α-2b (0, 50, or 500 IU/ml) or transfected with MxB-Flag DNA (0, 500, or 1,000 ng) for 48 h, and MxB levels were determined by Western blotting and quantified by use of a Li-Cor Odyssey system. (B) Huh7.5.1 cells were transfected with a plasmid expressing MxB-Flag or with empty vector DNA (EV) as the control and then infected with JFH1 HCVcc (MOI = 0.5). Levels of MxB and HCV core were determined by Western blotting. (C) Levels of HCV RNA in infected cells were quantified by qRT-PCR. The level of GAPDH mRNA was used as the internal control to normalize the level of viral RNA. (D) HCV production was determined by measuring the HCV core level in the supernatant by enzyme-linked immunosorbent assay (ELISA). (E) Levels of infectious progeny viruses in supernatants were determined by infecting Huh7.5.1 cells, followed by qRT-PCR quantification of viral RNA in the newly infected cells at 72 hpi. (F) Effect of MxB on HCV binding to target cells. Huh7.5.1 cells were incubated with JFH1 HCVcc (MOI = 0.5) at 4°C for 1 h. Anti-CD81 antibody was used to prevent HCV binding to its receptor, CD81. The attached HCV particles on the cell surface were quantified by determining the amount of viral genomic RNA by qRT-PCR. (G) Effect of MxB on HCV entry. After incubating Huh7.5.1 cells with JFH1 HCVcc, HCV that had entered Huh7.5.1 cells was quantified by determining the level of viral genomic RNA by qRT-PCR. IFN-α-2b was used as a control treatment of cells for 24 h before HCV infection. (H) Huh7 cells harboring the JFH1-derived subgenomic replicon were transfected with MxB-Flag plasmid DNA, followed by Western blotting to measure levels of MxB and HCV NS3. (I) Levels of HCV RNA were determined by qRT-PCR. (J) Effect of MxB on translation of HCV RNA. Huh7.5.1 cells were cotransfected with MxB-Flag plasmid DNA together with in vitro-synthesized JFH1 mRNA or JFH1(GND) mRNA. Levels of MxB and HCV core proteins were determined by Western blotting. Data are representative of at least three independent experiments, and values are expressed as means ± SD. For panels B to J, data are normalized to the control group, with the control value arbitrarily set to 1.

