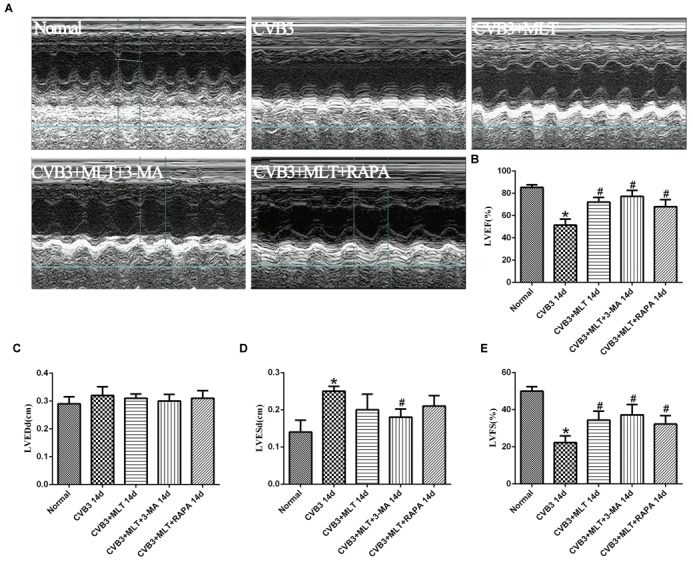
FIGURE 7.

The echocardiography results in each group on day 14 (n = 5 in each group). (A) Representative M-type cardiac ultrasound image. (B–E) The changes of LVEF, LVEDd, LVESd, and LVFS in five groups. LVEF, left ventricular ejection fraction; LVEDd, left ventricular end-diastolic dimension; LVESd, left ventricular end-systolic dimension; LVFS, left ventricular shortening fraction. ∗P < 0.05 versus the normal group, #P < 0.05 versus the CVB3 group.
