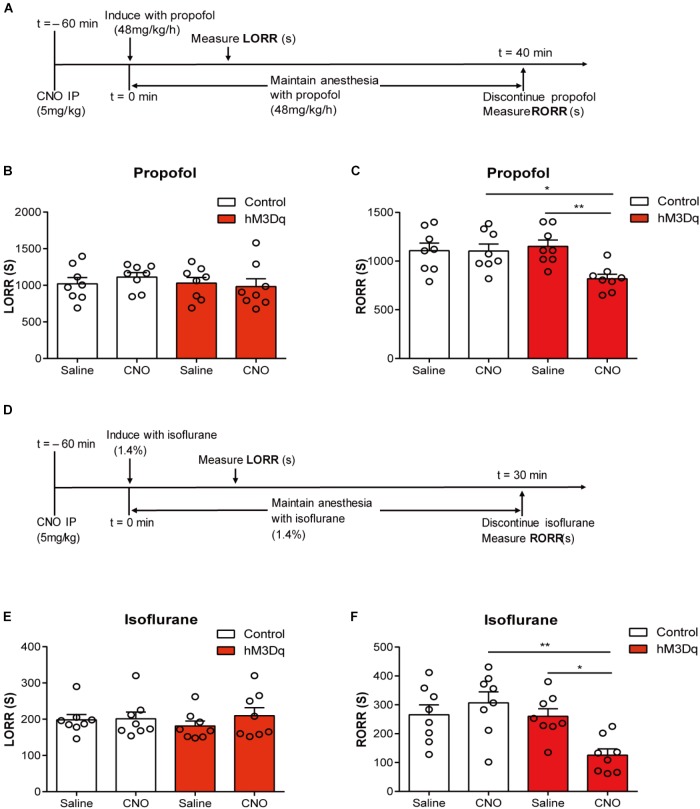
FIGURE 3.
PBN activation accelerates emergence from general anesthesia. (A) Timeline for quantifying changes in induction and recovery time with propofol. (B) Results of propofol inducing LORR time in the control group (AAV-hSyn-EGFP) and the hM3Dq group (AAV-hSyn-hM3Dq-EGFP), both of which received saline or CNO injection respectively. The hM3Dq animals injected with CNO do not show a significant difference (p = 0.4214, F1,28 = 0.6659, two-way ANOVA) in induction time relative to each of the other three groups. (C) The hM3Dq animals injected with CNO show a significant decrease in recovery time relative to hM3Dq-saline rats (p = 0.0066) and control-CNO rats (p = 0.0103) in propofol anesthesia (Bonferroni’s post hoc test after two-way ANOVA). (D) Timeline for quantifying changes in induction and recovery time with isoflurane. (E) The hM3Dq animals injected with CNO do not show a significant difference (p = 0.1844, F1,28 = 1.852, two-way ANOVA) in induction time of isoflurane anesthesia. (F) The hM3Dq rats injected with CNO show a significant decrease in recovery time relative to hM3Dq-saline rats (p = 0.0263) and control-CNO rats (p = 0.0016) in isoflurane anesthesia (Bonferroni’s post hoc test after one-way ANOVA). All summary graphs show mean ± SEM; n = 8 for each group. ∗p < 0.05 and ∗∗p < 0.01.

