FIGURE 4.
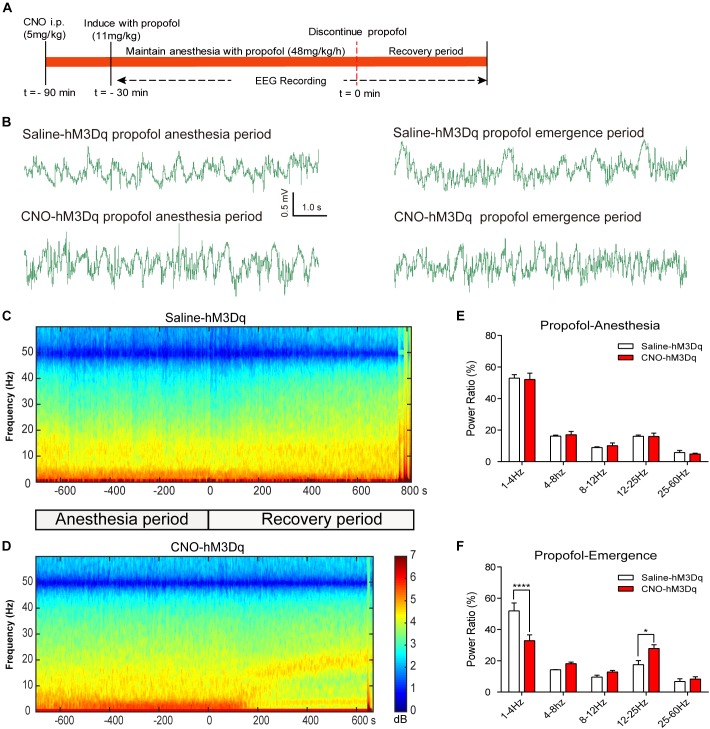
EEG changes under PBN activation in propofol anesthesia. (A) Timeline for EEG recording in propofol anesthesia. (B) Representative EEG traces during anesthesia and emergence period in hM3Dq rats pretreated with CNO or saline. (C,D) Spectrograms of EEG power during propofol anesthesia and emergence period after delivery of saline (C) or CNO (D) i.p. 0 on the time axis indicates the cession of propofol infusion. Warm colors (e.g., red) represent higher power at a given frequency, whereas cool colors (e.g., blue) represent lower power. (E) In the propofol anesthesia period, EEG traces 5 min before cessation of anesthetic were compared. No significant difference was found between CNO and saline use in any of the frequency bands quantified (F4,50 = 0.1241, p = 0.9731, two-way ANOVA). (F) In the recovery period, power spectrum analysis was conducted on data from propofol infusion stop to 5 min after that. CNO i.p. injection in hM3Dq rats shows a significant difference compared to the hM3Dq-saline group, displaying a significant decrease in δ power (1–4 Hz) and an increase in β power (12–25 Hz). All summary graphs show mean ± SEM (n = 6); ∗p < 0.05 and ∗∗∗∗p < 0.0001, Bonferroni’s post hoc test after two-way ANOVA.

