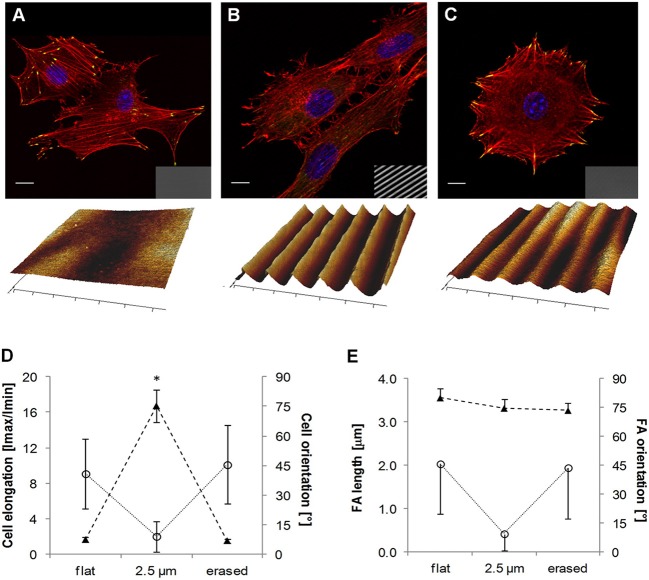
Figure 8.
Confocal images of NIH3T3 cells cultivated on (A) flat pDR1m substrate, (B) SRG linear grating, and (C) pattern-erased substrate with circularly polarized light. Insets in the bottom right show images in transmission. Representative AFM scans are reported below each image. (D) Plot of cell elongation (solid triangles) and cell orientation (open circles). (E) Plot of FA length (solid triangles) and orientation (open circles). The asterisk indicates a significant difference with respect to the flat case. Bars indicate the standard error of the mean in the case of cell elongation and FA length, whereas they represent the standard deviation in the case of cell and FA orientation. Reprinted with permission from Rianna et al. (2015). Copyright 2015 American Chemical Society.

