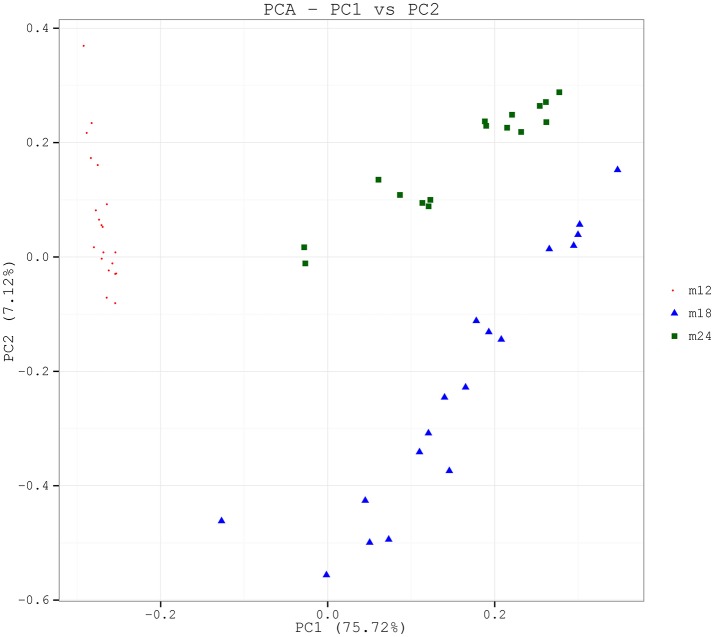
Figure 2.
PCA based on the weighted UniFrac distances at the OUT level at 97% identity. Each sample is represented by a dot. PC1 explained 75.72% of the variation observed, and PC2 explained 7.12% of the variation. The samples formed well-separated clusters corresponding to the three groups, suggesting that the bacterial structures between groups were different.

