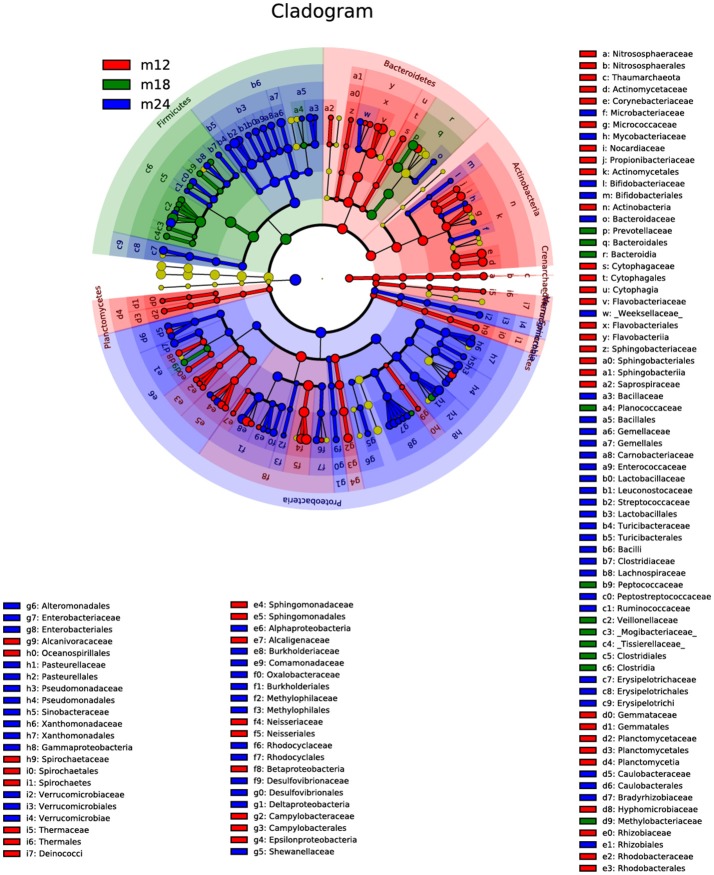
Figure 4.
The linear discriminant analysis effect size (LEfSe). The colored nodes from the inner to outer circles represent the top abundant taxa from phylum to genus level. The yellow nodes represent taxa showing no significant difference between groups, while nodes with other colors represent taxa showing significant difference between groups.

