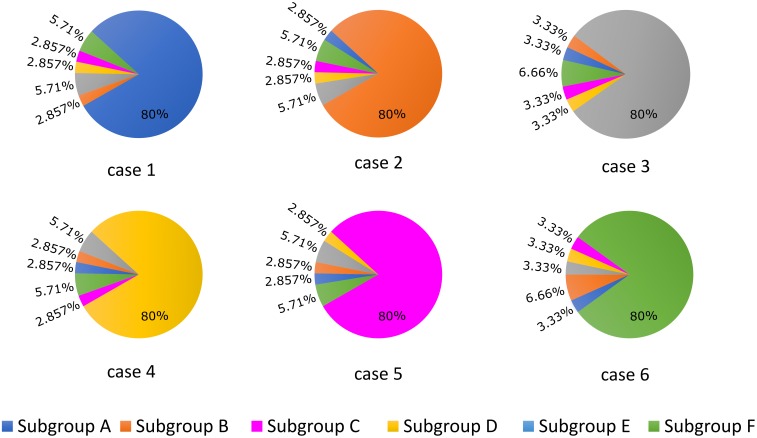
FIGURE 2.
Schematic representation of the LTCC distribution between the six different subgroups (A–F) for each case analyzed (1–6). The total number of LTCCs in the cells from each case was kept constant, but the channels were divided into the six subgroups in the ratios displayed. In case 1, 80% of the channels are located inside the T-tubular membrane, while the remaining ones were distributed to the remaining subgroups based on their probability to be associated with PDEs and β2ARs. In case 2, the dominant channel population was represented by channels located in T-tubules, lacking PDE association, while in case 3, the majority of channels were also located in the T-tubular membrane, but were not associated with β2ARs. Cases 4, 5, and 6 are similar to cases 1, 2, and 3, but their dominant channel populations are located in the surface sarcolemma.

