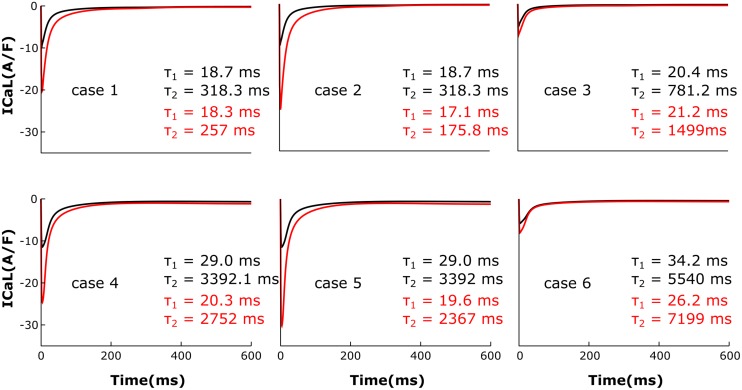
FIGURE 3.
The effect of microstructure remodeling on LTCC current. Total LTCC current was plotted over time from cells corresponding to cases 1–6 described in methods, under both basal (black) and sympathetic stimulation (red) conditions. The decay time constants for the current through the channels in the T-tubules and the ones in the bulk of the sarcolemma were displayed as τ1 and τ2.

