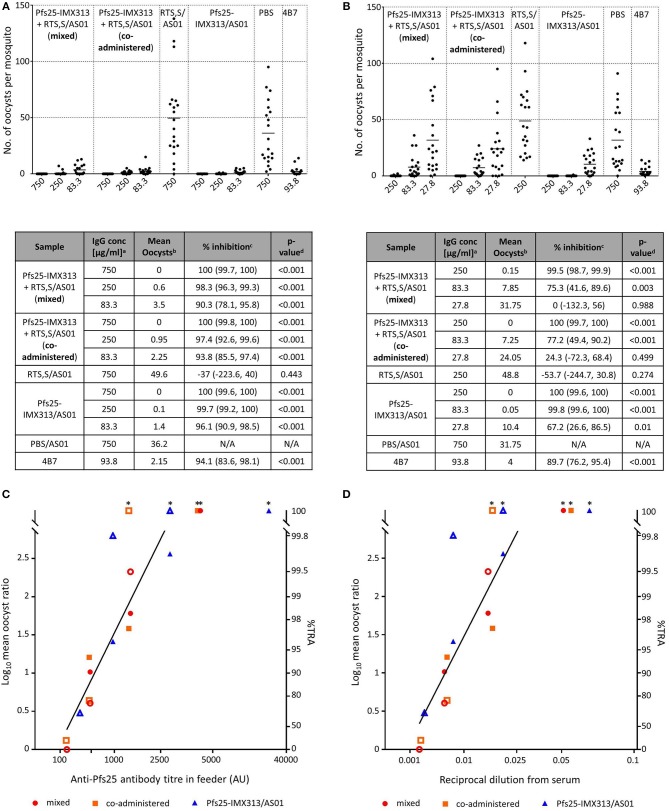
Figure 4.
Transmission blocking activity of anti Pfs25-IgG induced by immunization with Pfs25-IMX313 alone or in combination with RTS,S. (A,B) Total IgG, purified from pooled serum of each group (2 weeks post boost) was tested in SMFA in two independent experiments, one using total IgG concentrations of 750, 250 and 83.3 μg/ml (A) and one using total IgG concentrations of 250, 83.3, and 27.7 μg/ml. The transmission blocking monoclonal anti-Pfs25 antibody 4B7 was used as a positive control. Data points represent the number of oocysts in individual mosquitoes and the lines show the arithmetic mean. X-axis values are μg/ml total IgG in the assay. The results of the two feeds are summarized in the tables. aIgG concentration (μg/ml) in feeder. bArithmetic mean of oocyst intensity from 20 mosquitoes. cPercent inhibition of mean oocyst intensity and the 95% confidence interval (95% CI). dTwo-sided p-values testing whether % inhibition is significantly different from zero. (C,D) The quality of the anti-Pfs25-IgG used in the SMFA was assessed by linear two regression analyses, correlating the Log10-transformed ratios of mean oocyst counts in control and test samples (log-mean ratio, LMR) with the anti-Pfs25 specific IgG level in the feeder (C) or the reciprocal dilution factor from the original serum pool (D). LMR is plotted on the left y-axis. The right y-axis shows the correspondent %TRA. Values on the x-axis are plotted on a square root scale. The black line shows the shared linear fit for IgG from all groups. Filled and unfilled shapes show data points from the two independent SMFA experiments. Data points marked with an asterisk were excluded from the analysis as they showed 100% TRA (upper plateau level of dose response).

