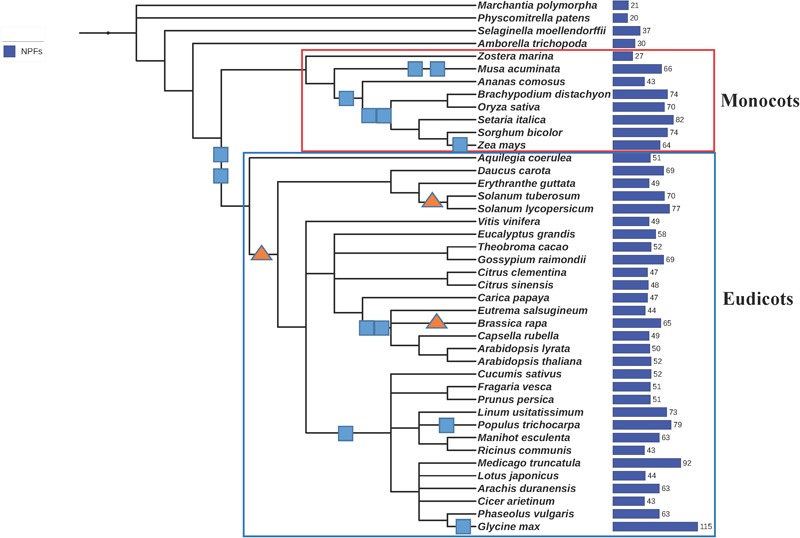
FIGURE 3.

Phylogenetic tree of the 42 plants whose genomes were used in this study. We generated a phylogenetic tree from a list of taxonomic names of the 42 plants analyzed in this study using the online tool phyloT, a phylogenetic tree generator based on NCBI taxonomy (http://phylot.biobyte.de/). The tree was visualized using iTOL (http://itol.embl.de/). Whole genome duplications (WGD) are represented by squares, whole genome triplications are represented by triangles (based on Lee et al., 2012, 2017). The total number of NPFs contained in each genome is reported on the right. Monocots and eudicots are included in the red and blue rectangles, respectively.
