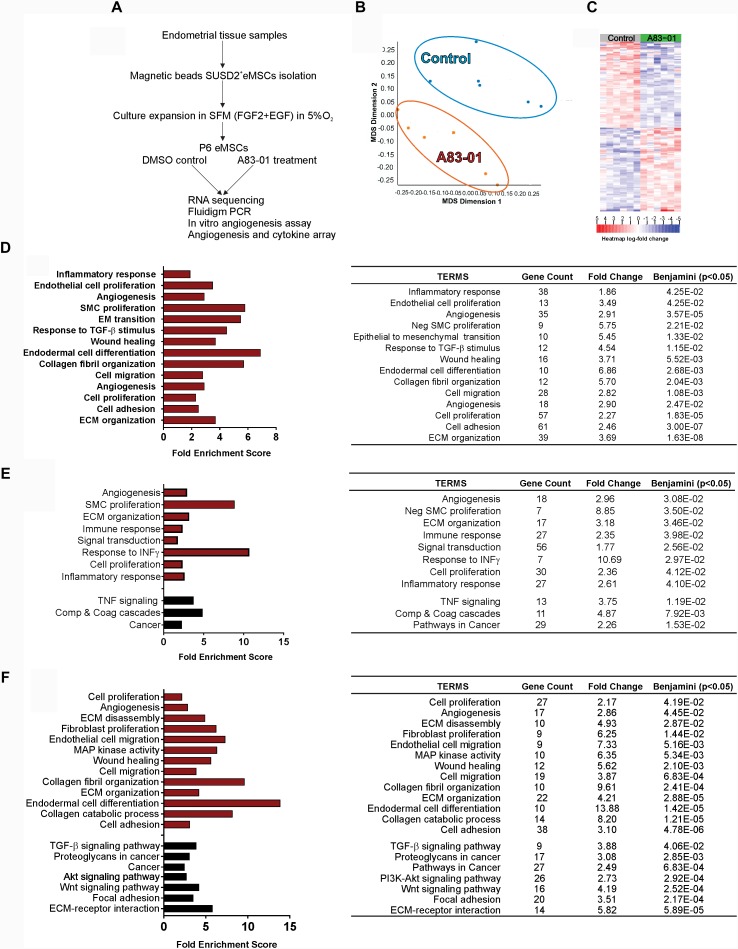
FIGURE 1.
Transcriptome of A83-01 treated P6 eMSCs. (A) Schematic showing study design and experimental steps before RNA sequencing, and subsequent validation and functional assays. (B) Principle Component Analysis demonstrating clear separation of gene transcripts between A83-01-treated and control eMSCs. Each dot represents an experimental replicate. (C) Heat map showing the top 200 up- and down-regulated DEGs with FDR <0.01 and >2 fold change (n = 6). (D) GO analysis of biological processes of all DEGs using DAVID 6.8. A83-01 altered the expression of genes involved in the inflammatory response, angiogenesis, and ECM and collagen fibril organization. (E,F) GO and KEGG analysis of functional annotations and pathways of upregulated (E) and downregulated (F) genes. Red bars (GO) and black bars (KEGG). Fold enrichment change were analyzed by Benjamini–Hochberg (p < 0.05).

