
FIGURE 4.
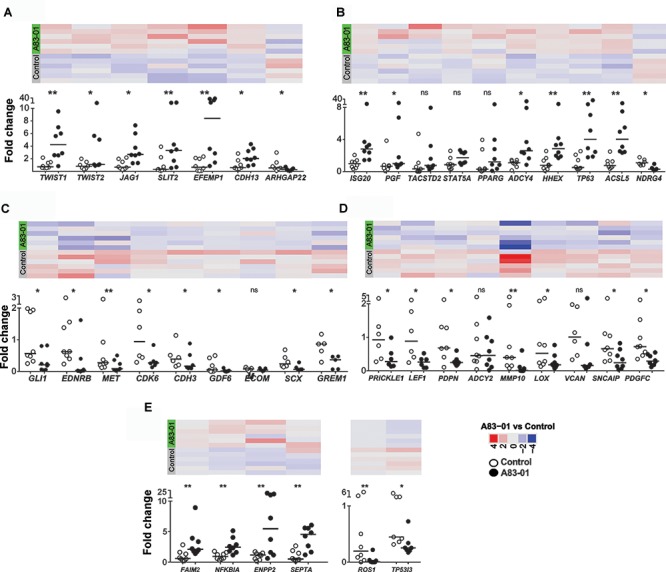
Differentially expressed genes (DEGs) confirmed by Fluidigm qPCR. (A) MSC potency, (B) proliferation, (C) anti-proliferation, (D) fibroblast and (E) apoptosis-related genes were validated in control and A83-01 treated P6 eMSCs. Data points (black circles, A83-01-treated, white circles, control) and medians are shown. Panels above each graph shows the heat map of the corresponding genes in RNA seq (∗p < 0.03, ∗∗p < 0.002, n = 6–8).