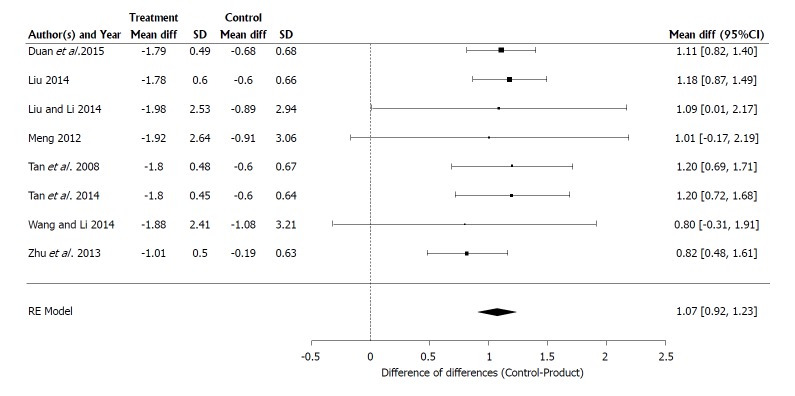
Figure 7.
Forest plot of the results of a random effects meta-analysis with 8 studies evaluating the effect of Medilac-S® in combination with conventional drug therapy on the change in mean histological score, evaluating colonic histological specimens for inflammation and crypt distortion. “Mean Diff” is the change of the treatment mean score from the baseline mean score and “SD” is the standard deviation of the mean change; the difference between the treatment and control of the change in the mean score and its 95%CI for each study is listed on the right hand side of the graph; the 95%CI for the estimated mean difference in the change from baseline for each concomitant drug therapy category is shown as a shaded diamond with the endpoints of the diamond being the CI endpoints and the location of the maximum width of the diamond being at the estimated mean difference for that drug type; the vertical dashed line at 0 indicates a difference of 0 which occurs when there is no observed difference between the change from baseline for the treatment and the control.

