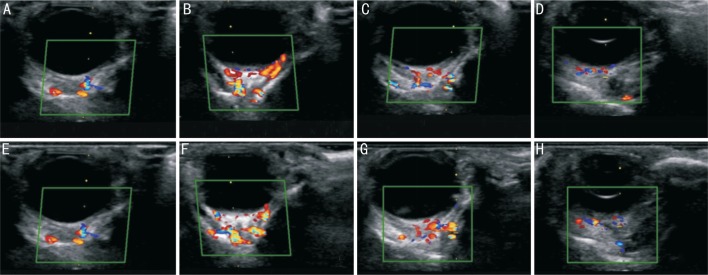
Figure 7. Contrast between ultrasound images of retrobulbar blood flow before and after application of hot compress.
A-D: Ultrasonographic images of the CRA, LPCA, OA, and CRV, respectively, recorded before the hot compress application; E-H: Ultrasonographic images of the CRA, LPCA, OA, and CRV, respectively, after the hot compress application.

