Figure 2.

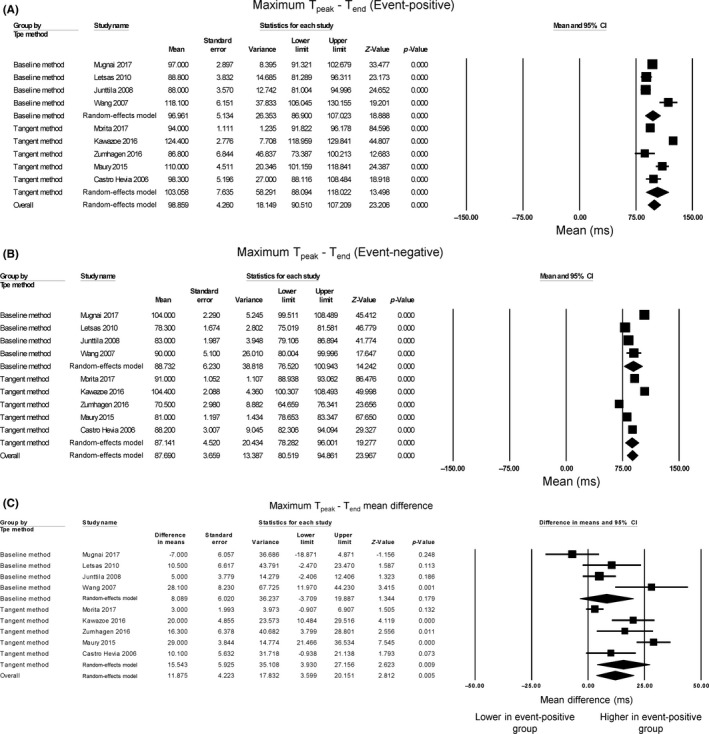
Forest plot demonstrating Tpeak‐Tend intervals obtained from event‐positive (A) and event‐negative (B) groups and the mean difference between both groups (C) in Brugada Syndrome

Forest plot demonstrating Tpeak‐Tend intervals obtained from event‐positive (A) and event‐negative (B) groups and the mean difference between both groups (C) in Brugada Syndrome