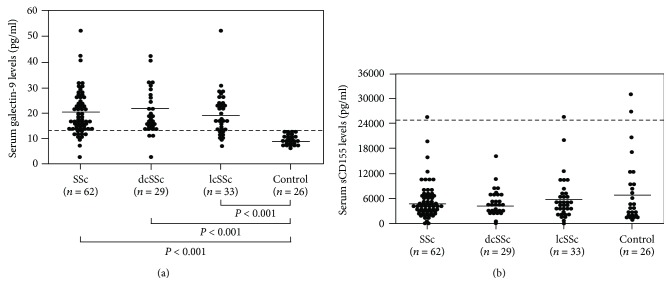
Figure 1.
Comparison of groups according to (a) serum galectin-9 and (b) sCD155 levels. The control group comprised healthy individuals. The bars indicate the mean values in each group. The dashed line indicates the cut-off value (mean + 2 SDs of control values). SSc: systemic sclerosis; dcSSc: diffuse cutaneous SSc; lcSSc: limited cutaneous SSc.

