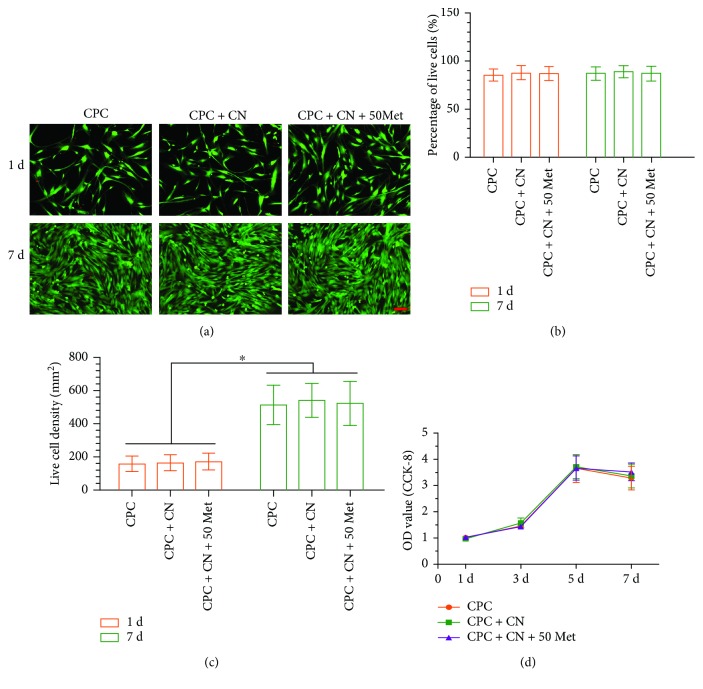
Figure 3.
Viability and proliferation of DPCs attached on CPC scaffold surface. (a) Representative live/dead images of metformin-treated DPCs at days 1 and 7, with live cells stained green and dead cells shown in red. In all three groups, live cells were abundant, and dead cells were few (scale bar = 50 μm). (b) The percentage of live cells of DPCs was around 89%. (c) All groups exhibited an increasing live cell density; ∗P < 0.05. (d) CPC + CN + 50Met had no effect on cell proliferation. Data represent mean ± SD of three independent experiments with triplicates.

