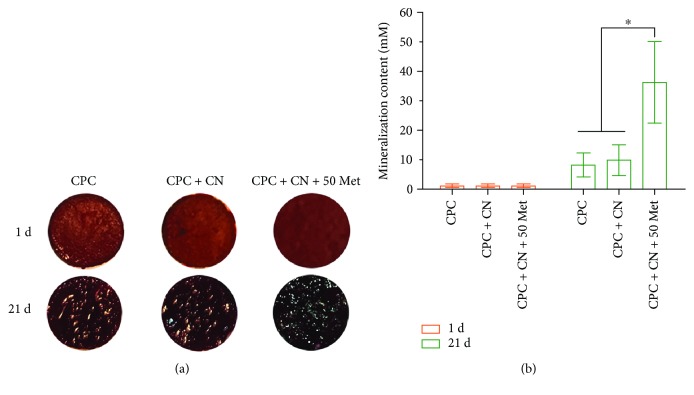
Figure 6.
Mineralization by DPCs analyzed by Alizarin Red S staining. (a) After the cells were cultured for 21 days in osteogenic differentiation media, the mineral matrix exhibited a denser and darker red staining with increasing culture time. (b) Quantification of Alizarin Red S staining. The graph shows that the amount of calcium was significantly greater in the CPC + CN + 50Met than in the CPC control and CPC + CN control (∗P < 0.05). Data represent mean ± SD of three independent experiments with triplicates.

