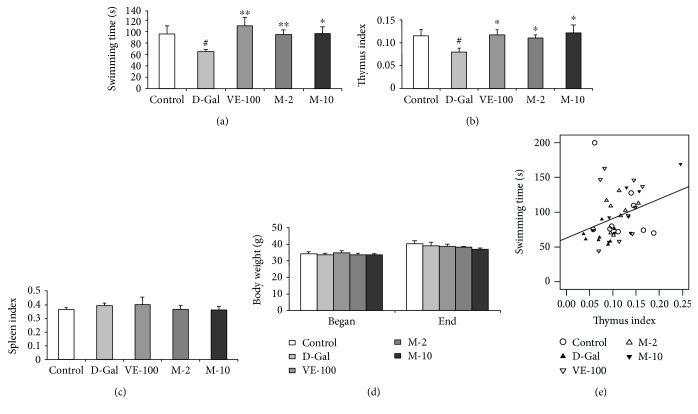
Figure 4.
Effect of MAT on weight-loaded swimming test, thymus and spleen coefficients, body weight in the D-gal-induced aging mice, and Pearson's correlation between the swimming time versus thymus coefficients. (a) The weight-loaded swimming test: mice were loaded aluminum (5% of their body weight) attached to the tail, and the swimming time was recorded in seconds. (b) The thymus and (c) spleen coefficients: the animals were decapitated after the weight-loaded swimming test, and thymus coefficients were analyzed. (d) The body weight changes between the start of experiment and the end of the experiment. The data are expressed as mean ± SEM. n = 9, # p < 0.05 vs. vehicle control group and ∗ p < 0.05, ∗∗ p < 0.01, and ∗∗∗ p < 0.001 vs. D-gal-treated group. (e) Pearson's correlation between swimming time versus thymus coefficients was determined. Control group (saline + 2% ethanol in saline, hollow circle), D-gal group (D-gal 150 mg/kg + 2% ethanol in saline, filled triangle), VE-100 (D-gal 150 mg/kg + VE 100 mg/kg, inverted hollow triangle), M-2 (D-gal 150 mg/kg + matrine 2 mg/kg, hollow triangle), and M-10 (D-gal 150 mg/kg + matrine 10 mg/kg, inverted filled triangle), n = 45.

