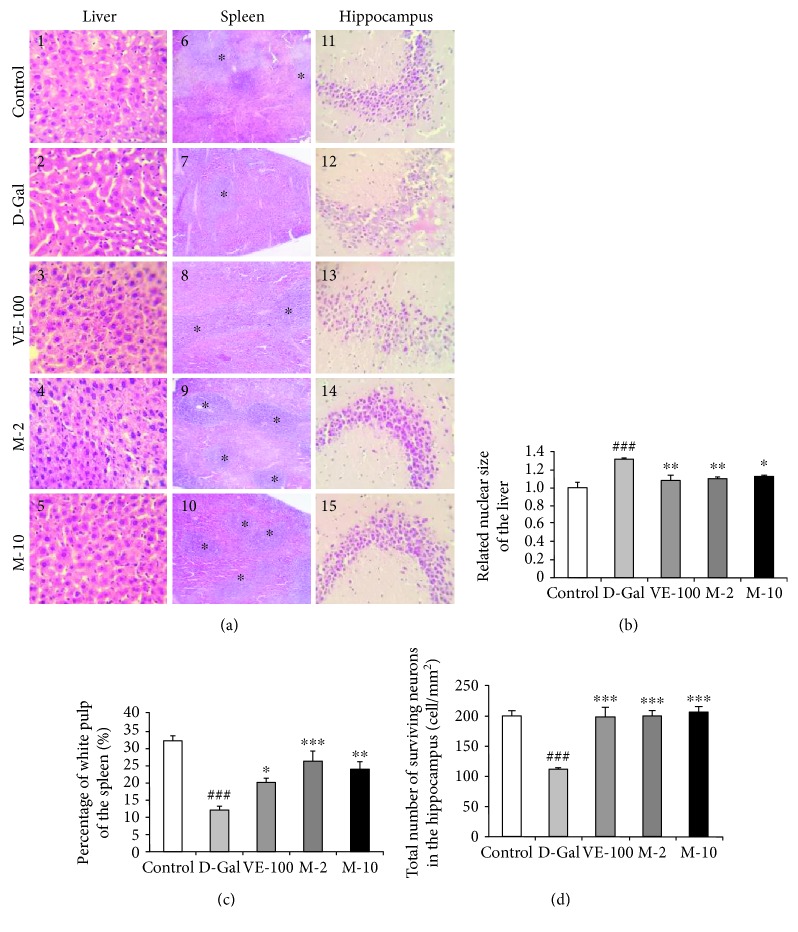
Figure 5.
Effect of MAT on liver, spleen, and brain histopathological alterations. (a) The histopathological alterations of the liver, spleen, and brain (HE); the magnification of the liver and brain is 400 times, and that of spleen is 100 times. (b) The related nuclear size of the liver, (c) spleen white pulp proportion, and (d) surviving neurons of CA3 area of the hippocampus. The data are expressed as mean ± SEM, n = 6. ## p < 0.01 and ### p < 0.001 indicate significant difference compared with the control group; ∗ p < 0.05, ∗∗ p < 0.01, and ∗∗∗ p < 0.001 indicate significant difference compared with the D-gal-treated control group.

