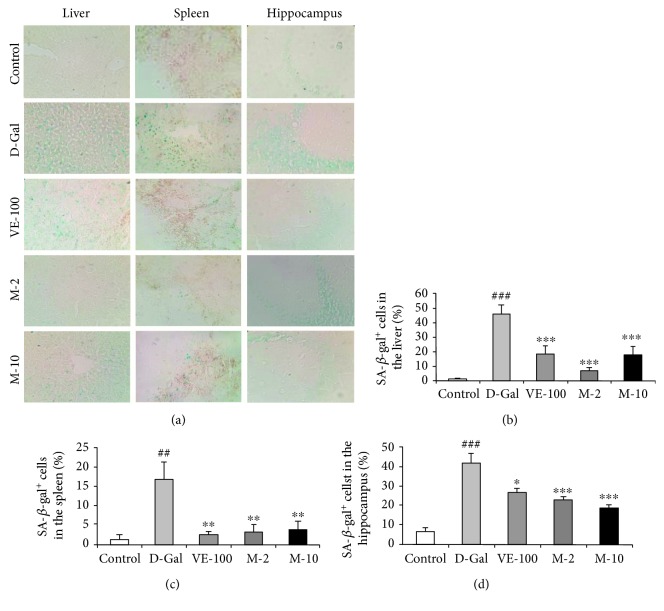
Figure 6.
MAT attenuated the increased activity of SA-β-Gal in liver, spleen, and brain of D-gal-induced aging mice. (a) Representative image of SA-β-gal staining in each group was captured (magnification 400x). (b–d) Quantification of the percentage of SA-β-gal-positive cell number in the liver, spleen, and hippocampus. Blue staining means SA-β-gal-positive cells. The data are expressed as mean ± SEM, n = 6. ## p < 0.01 and ### p < 0.001 indicate significant difference compared with the control group; ∗ p < 0.05, ∗∗ p < 0.01, and ∗∗∗ p < 0.001 indicate significant difference compared with the D-gal-treated control group.

