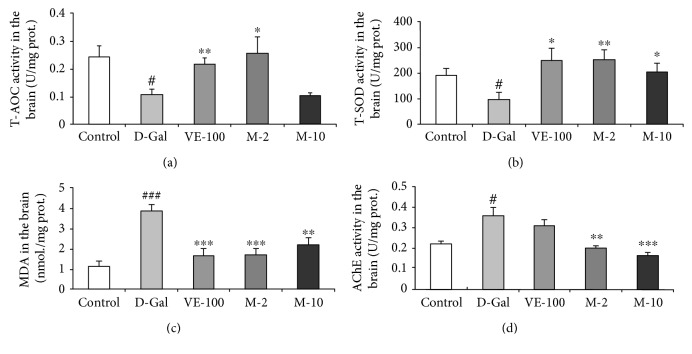
Figure 9.
Effect of MAT on T-AOC, T-SOD, MDA, and AChE activities in the brain. (a) Changes in T-AOC, (b) T-SOD activity, (c) MDA level, and (d) AChE activity in the brain. Each value represents mean ± SEM of 6 mice. # p < 0.05 and ### p < 0.001 indicates significant difference compared with the control group; ∗ p < 0.05, ∗∗ p < 0.01, and ∗∗∗ p < 0.001 indicate significant difference compared with the D-gal-treated control group.

