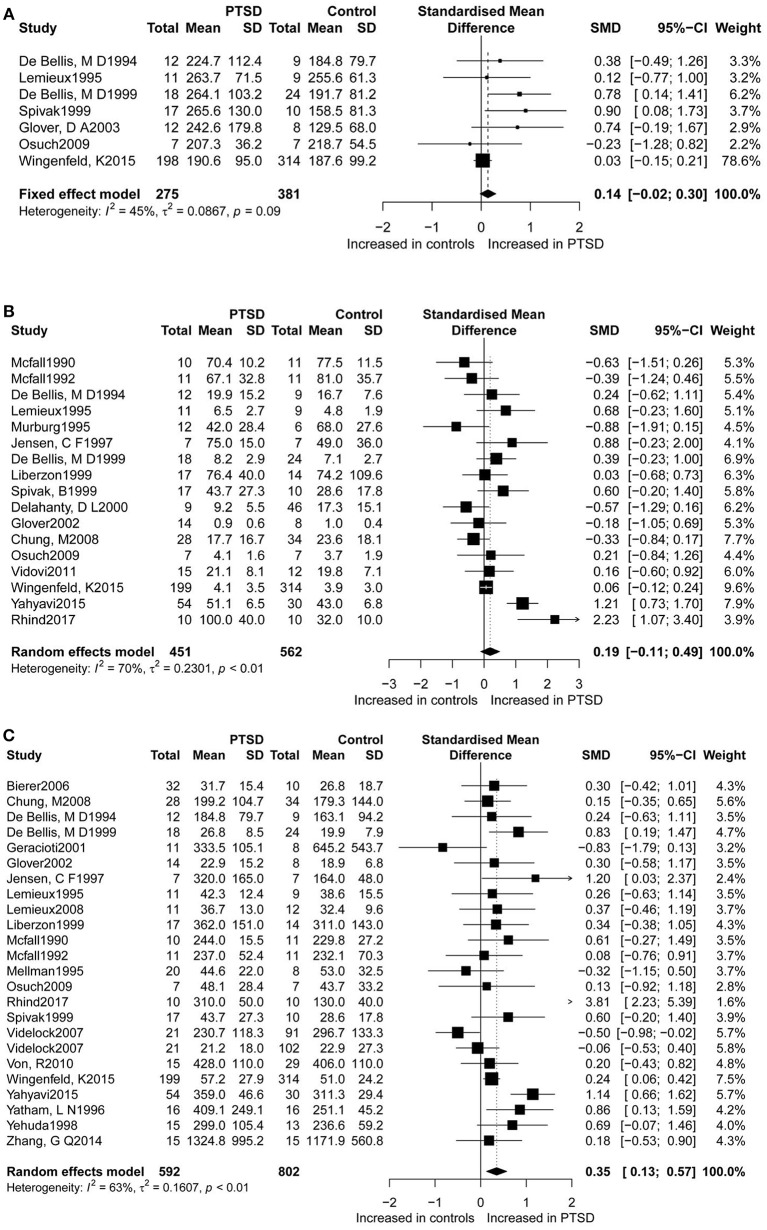
Figure 2.
Forest plot of dopamine (A), epinephrine (B), and norepinephrine (C) between PTSD participants, and controls. Study effect sizes of catecholamines differences between post-traumatic stress disorder and controls. Each data marker represents a study, and the size of the data marker is proportional to the total number of individuals in that study. The summary effect size for each catecholamine is denoted by a diamond. PTSD, post-traumatic stressdisorder; SMD, standardized mean difference.

