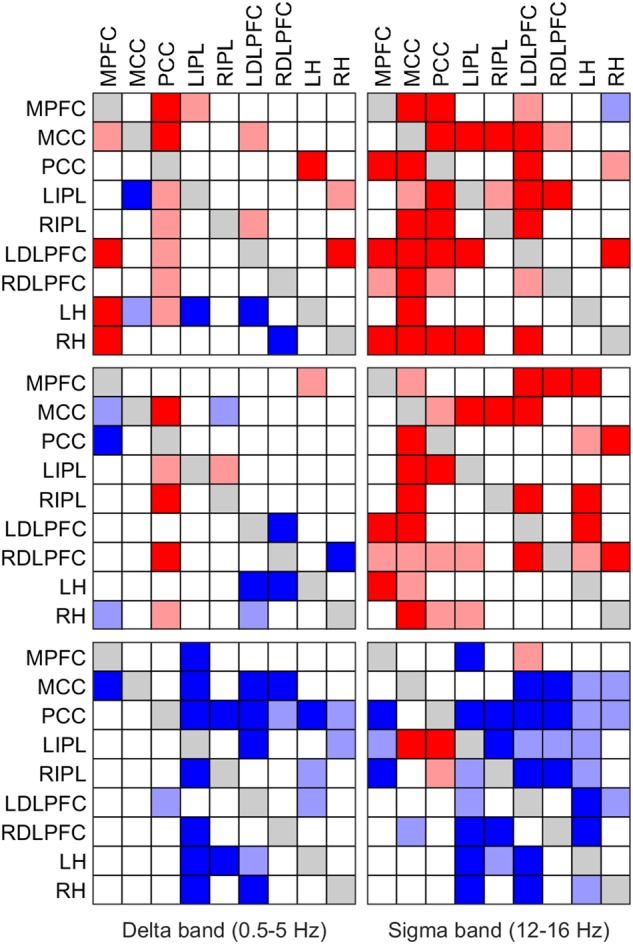
FIGURE 4.

Significant change of iCOH (connectivity) in the delta (left column) and sigma band (right column) at the SOn transition in baseline (top) and recovery (middle) and after SOn between baseline and recovery (bottom). Significant differences between conditions are plotted in matrix fashion; columns represent “senders”, rows are “receivers” of information flow. For the abbreviations of the ROIs see Table 1. Red squares (light and dark) indicate connectivity before SOn < connectivity after SOn (top two rows) and connectivity at baseline < connectivity at recovery (bottom row); blue squares (light and dark) indicate the opposite change. Two significance thresholds were applied to reveal the hierarchy of changes: the lighter colors correspond to p < 0.05 (SnPM), the darker ones to p < 0.025 (SnPM).
