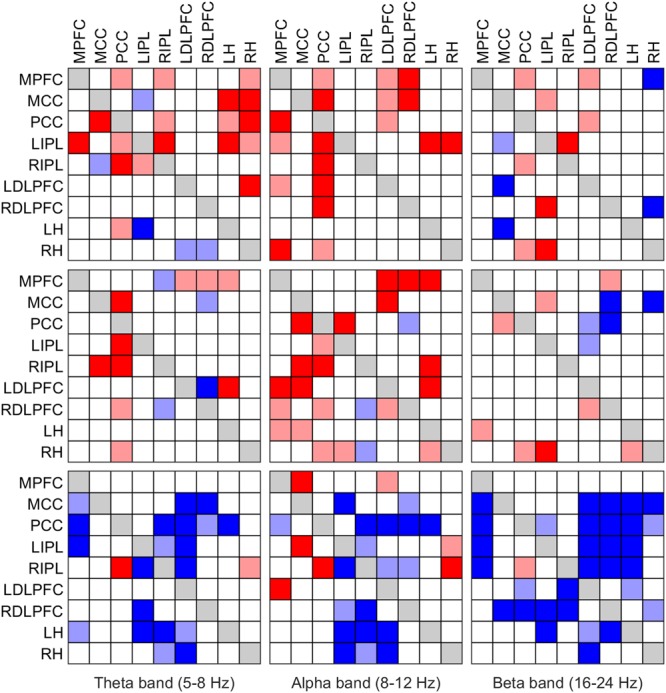
FIGURE 5.

Significant change of iCOH (connectivity) in the theta (left column), alpha (middle column) and beta band (right column) at the SOn transition in baseline (top) and recovery (middle) and after SOn between baseline and recovery (bottom). For details see Figure 4.
