FIGURE 1.

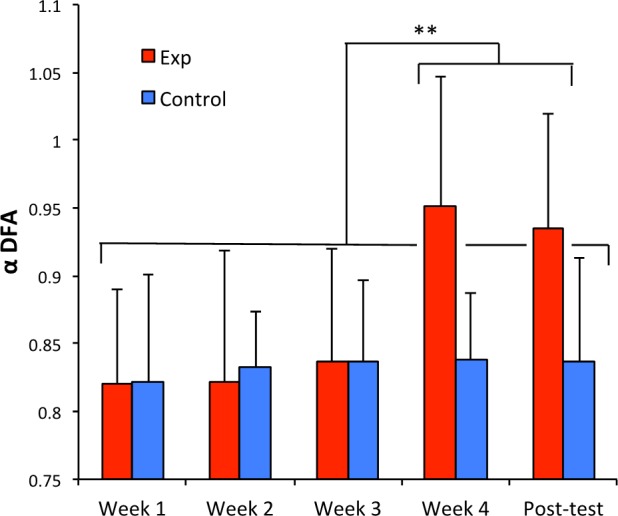
Average α-DFA exponents computed for participants in solo sequences (red: experimental group, blue: control group), over the four training weeks and the post-test. Error bars represent standard deviation. ∗∗p < 0.01.

Average α-DFA exponents computed for participants in solo sequences (red: experimental group, blue: control group), over the four training weeks and the post-test. Error bars represent standard deviation. ∗∗p < 0.01.