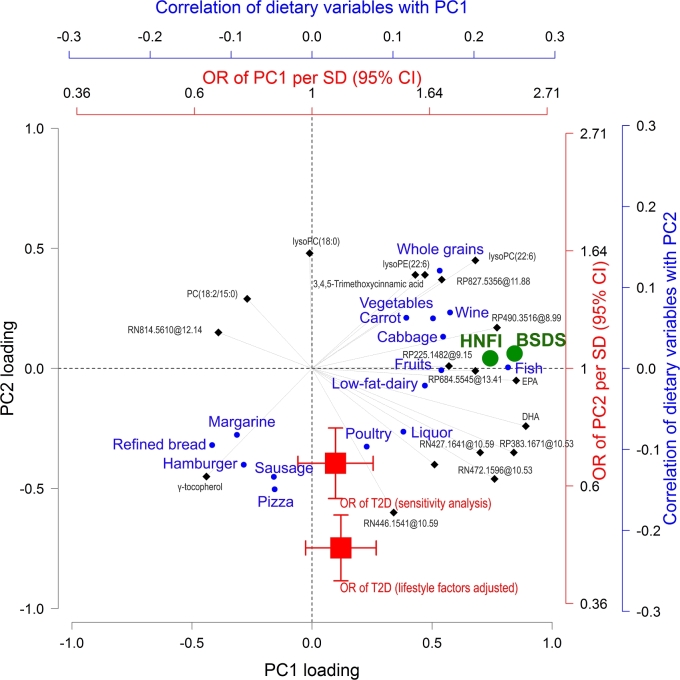
FIGURE 3.
Associations between diet, index-related metabolites, and risk of developing T2D. The “triplot” represents the correlations between metabolites, dietary variables, and ORs of T2D. Correlations between PC scores and dietary variables (individual foods in blue circles and dietary indexes in green circles) and ORs per SD (95% CI) of T2D for scores (red squares) are superimposed. Correlations between PC scores and dietary variables are visualized if partial Spearman correlation at a Bonferroni-adjusted P < 0.05 controlled for age, gender, case/control status, BMI, smoking status, education, and physical activity. ORs were obtained from a lifestyle factors–adjusted conditional logistic regression model and a model further adjusted for fasting plasma glucose (millimoles per liter), BMI, total cholesterol (millimoles per liter), triglycerides (millimoles per liter), and blood pressure (mm Hg). For simple interpretation, metabolites, individual foods, and ORs pulling along the same axis in the plot are associated. Dietary indexes are orthogonal to ORs and therefore not associated with T2D risk. Metabolites denoted as classes (MSI 3) are presented as “putative chemical class mass @retention time,” whereas unknown compounds (MSI 4) are presented as “analytical mode m/z @ retention time.” HN, hydrophilic interaction chromatography ESI− mode; HP, hydrophilic interaction chromatography ESI+ mode; lysoPC, lysophosphatidylcholines; lysoPE, lysophatidylethanolamine; MSI, Metabolomics Standard Initiative; PC, principal component; RN, reverse phase chromatography ESI− mode; RP, reverse phase chromatography ESI+ mode; T2D, type 2 diabetes.

