
Figure 4.
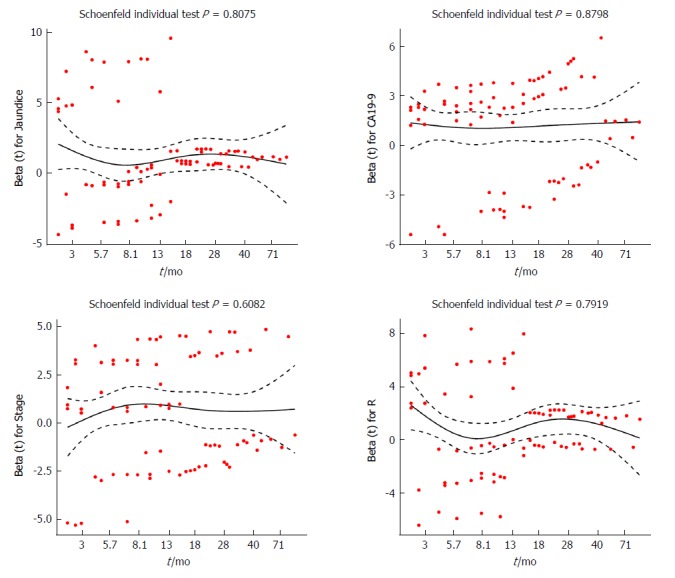
Schoenfeld residuals vs ranked survival time for selected predictors. The X-axis represents the survival time, while the Beta values referring to jaundice, carbohydrate antigen 19-9, stage, and resection are shown on the Y-axis. CA19-9: Carbohydrate antigen 19-9; R: Resection.