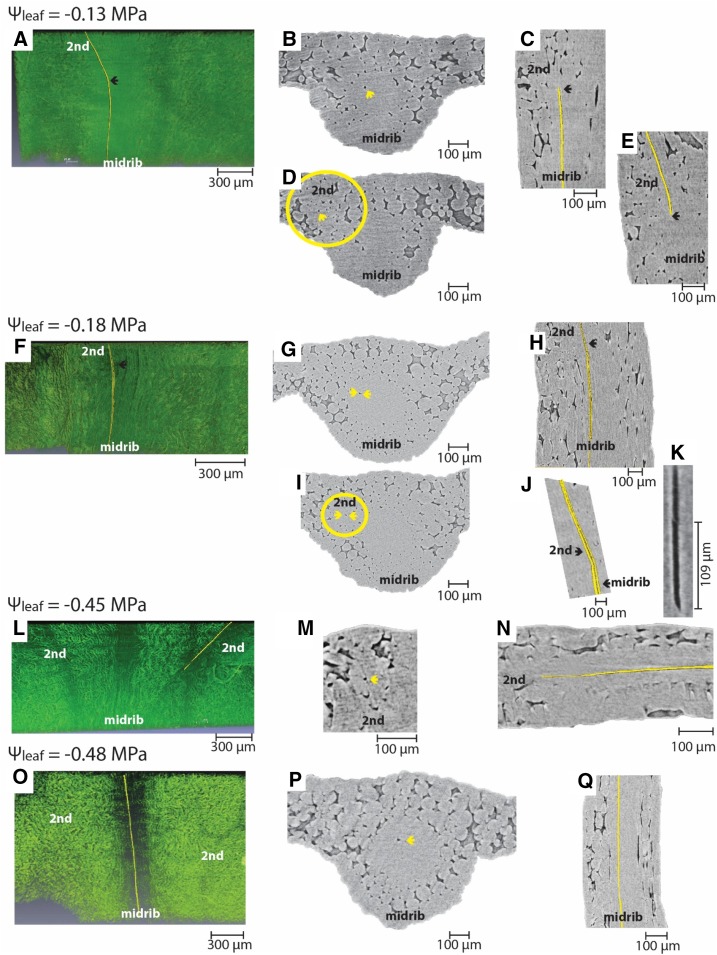
Figure 4.
Rare embolisms were observed in a few individual leaves. In two samples, an embolized conduit was observed in the midrib; it continued into a secondary vein (A and F; the embolized conduits are depicted in yellow). The embolized conduit in the midrib and secondary vein can be seen in cross sections (B, D, G, and I) and longitudinal sections (C, E, H, and J) of the microCT scan. The arrows point to the embolized conduit (appearing as black in the microCT images). Because of the two dimensionalities of these sections, embolism in the midrib and secondary vein might appear disconnected (C and E). Note that, while the embolism was present in only one conduit per cross-sectional image, multiple conduits spanned the length of the midrib and secondary vein (as can be observed in K, where two conduits can be seen connected to one another). Most likely, a first conduit in the midrib embolized, and all the conduits connected directly to that one upstream embolized after. In one sample, an embolized conduit was observed isolated in the secondary vein (L–N), while in another sample, an embolized conduit was observed spanning the midrib length (O–Q).

