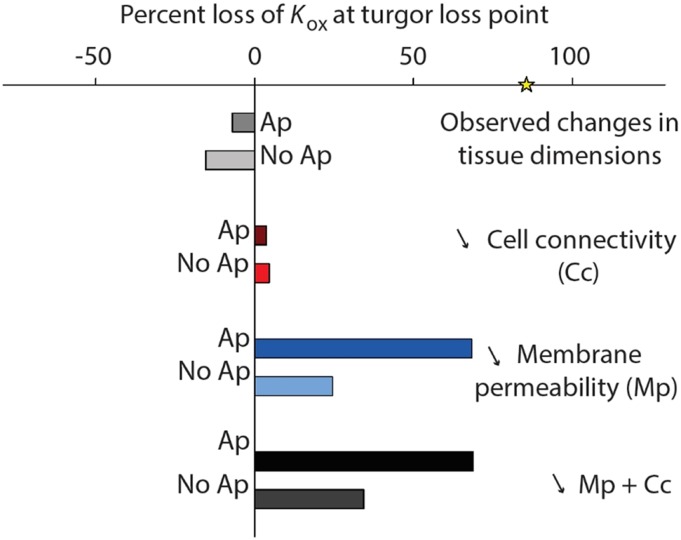
Figure 5.
Results from simulations using a spatially explicit model of leaf outside-xylem water to test for potential drivers of the decline in Kox in dehydrating leaf transport (MOFLO 2.0; Table 1; see “Materials and Methods”). The Kox was first computed based on the decline of observed cell size and airspace alone (gray bars), which resulted in an increase in Kox (negative percentage loss of Kox; mainly due to the shortening of pathways from the veins to stomata). We then modeled the Kox decline according to three scenarios (although always including the effect of tissue dimensional changes): an 80% decline at −0.5 MPa in (1) cell connectivity (red bars), (2) cell membrane permeability (blue bars), and (3) cell wall thickness (black bars). All simulations were run with (Ap; darker color) or without (No Ap; lighter color) an apoplastic barrier at the bundle sheath cells. The yellow star on the x axis represents the percentage observed Kleaf decline at −0.5 MPa (measured with the evaporative flux method; see “Materials and Methods”).

