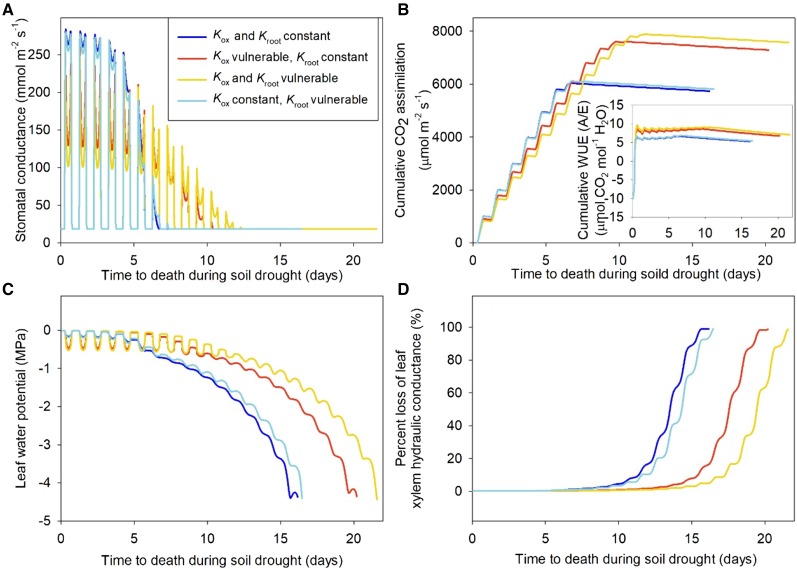
Figure 7.
Daily simulated patterns of gs (A), Ψleaf (B), An, tot (C), and percentage loss of Kx (D) during the progression of a simulated soil drought (SurEau model; Table 1; see “Materials and Methods”). Four scenarios were modeled: (1) both Kleaf and root hydraulic conductance (Kroot) were vulnerable to dehydration prior to the turgor loss point (yellow lines); (2) Kleaf was vulnerable but not Kroot (red lines); (3) Kroot was vulnerable but not Kleaf (light blue lines); or (4) neither Kleaf nor Kroot was vulnerable (dark blue lines). The inset in C shows cumulative water-use efficiency (WUE; calculated as An, tot over total transpiration rate) over time. Scenarios including a vulnerable Kleaf showed leaves that showed highest water-use efficiency, An, tot, and survived longer under drought conditions.

