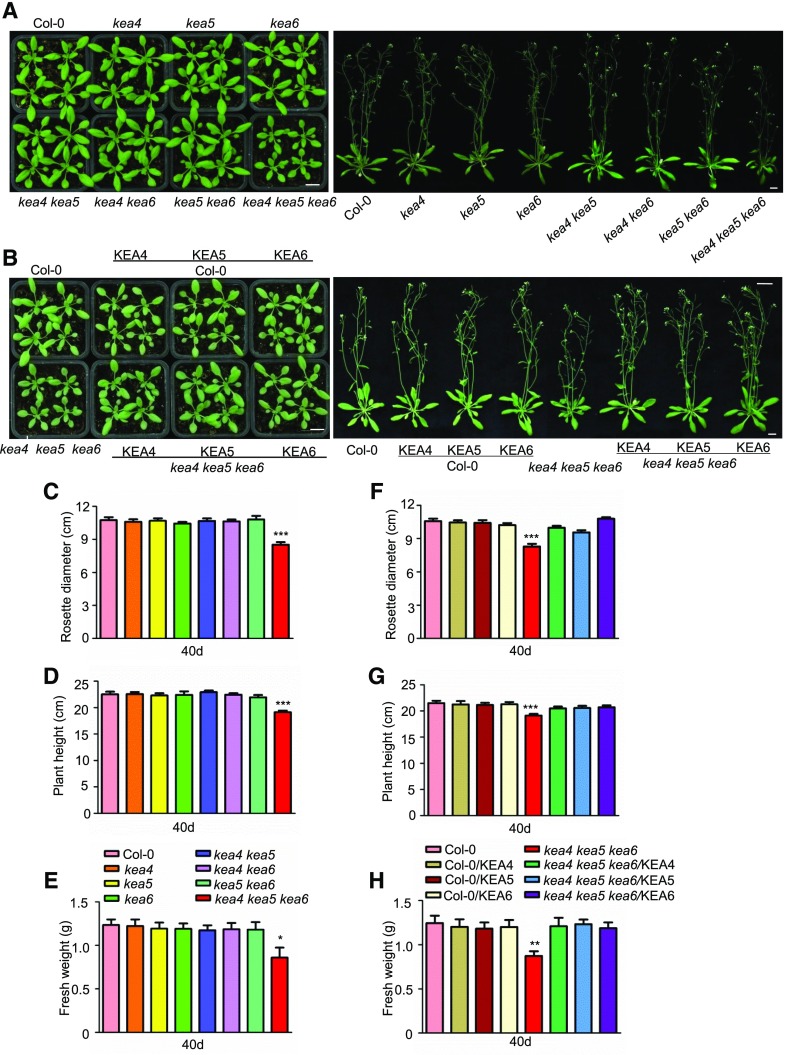
Figure 1.
The kea4 kea5 kea6 mutant is defective in growth. A and B, Seedling growth. A, Mutants. B, Overexpression lines. Photographs were taken at 21 d (left) and 40 d (right). Bars = 1 cm. C to E, Rosette diameters (C), plant heights (D), and fresh weight (E) of mutants measured at 40 d (mean ± se; n = 15 plants). F to H, Rosette diameters (F), plant heights (G), and fresh weight (H) of the overexpression lines measured at 40 d (mean ± se; n = 15 plants). In C to F, statistics by Student’s t test are shown: *, P < 0.05; **, P < 0.01; and ***, P < 0.001.

