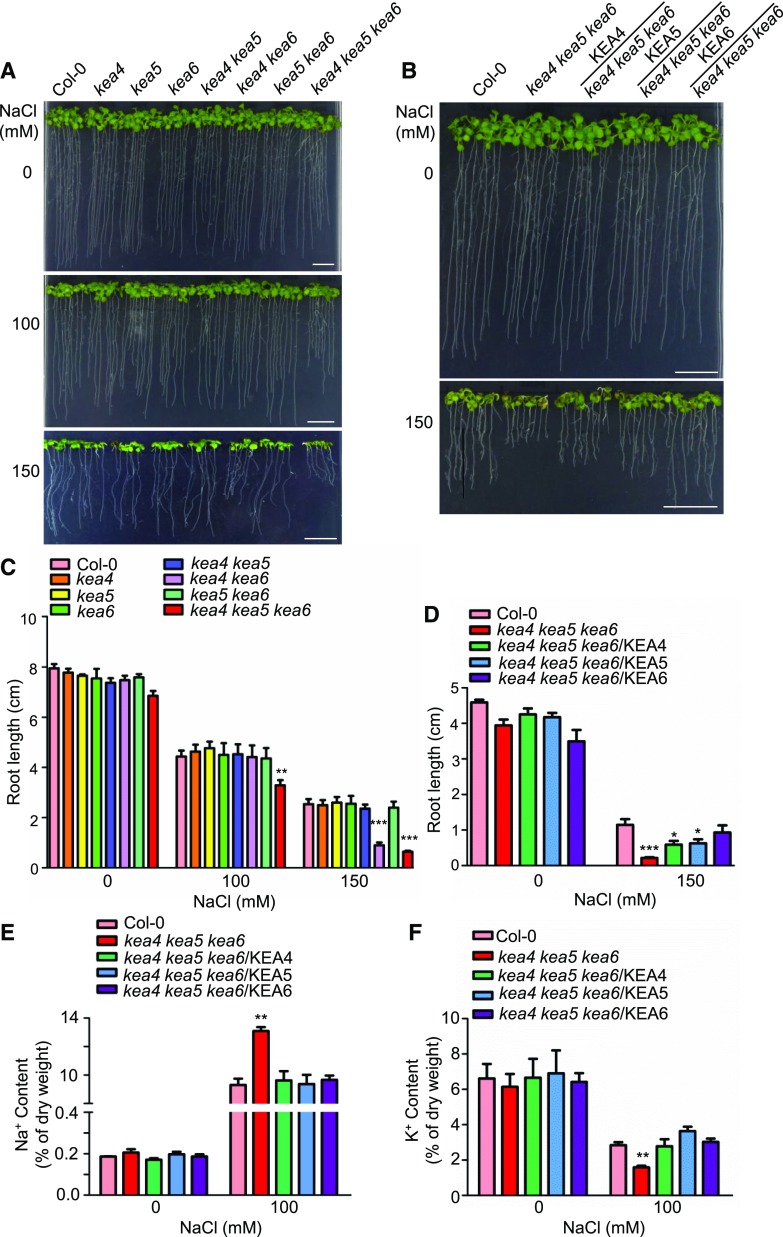
Figure 5.
The kea4 kea5 kea6 mutant is sensitive to salt stress. A and B, Growth of the mutants and overexpression lines under NaCl treatment. A, The mutants. B, The overexpression lines. Four-day-old seedlings grown on 1/2 MS medium were transferred to 1/2 MS medium containing 0, 100, and 150 mm NaCl. Photographs were taken at 10 d under salt stress. Bars = 1 cm. C, Root length for seedlings from A (mean ± se; n = 8 seedlings). D, Root length for seedlings from B (mean ± se; n = 8 seedlings). E, Na+ content assay (mean ± se; n = 3 times). F, K+ content assay (mean ± se; n = 3 times). In C to F, statistics by Student’s t test are shown: *, P < 0.05; **, P < 0.01; and ***, P < 0.001.

