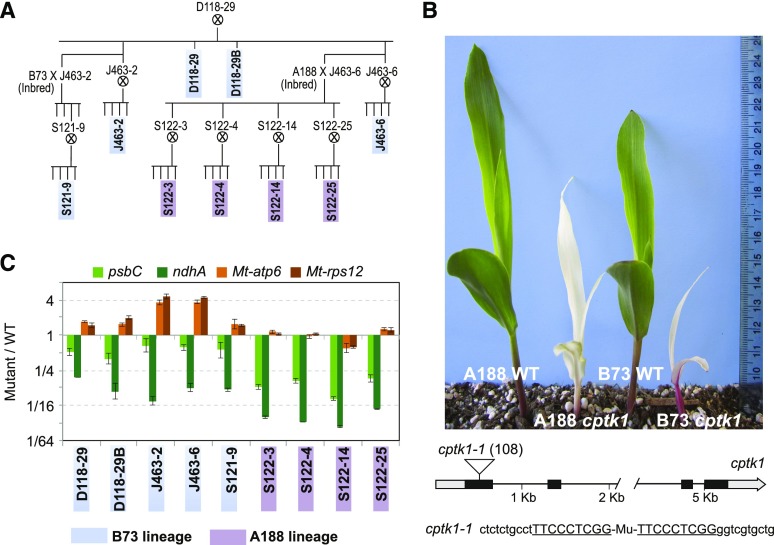
Figure 1.
Albino phenotype and reduced cpDNA copy number in cptk1 plants. A, Pedigree showing the genealogical relationship between the assayed plants. B, Albino phenotype of homozygous cptk1 plants in two different inbred backgrounds. The diagram shows the cptk1 gene (GRMZM2G048821 in B73 genome v3) and the positions of the Mu insertion. The target site duplication is underlined. The nucleotide position with respect to the start codon is shown in parentheses. C, Quantification of mitochondrial and plastid DNA in cptk1 mutants. Each seedling is identified by the number of its family, whose relationships are diagrammed in A. Segments of the plastidial psbC and ndhA and mitochondrial atp6 and rps12 genes were assayed by qPCR. Results are the mean ± sd of technical triplicates and are represented as a ratio with respect to the wild-type (WT) in a log2 scale.

