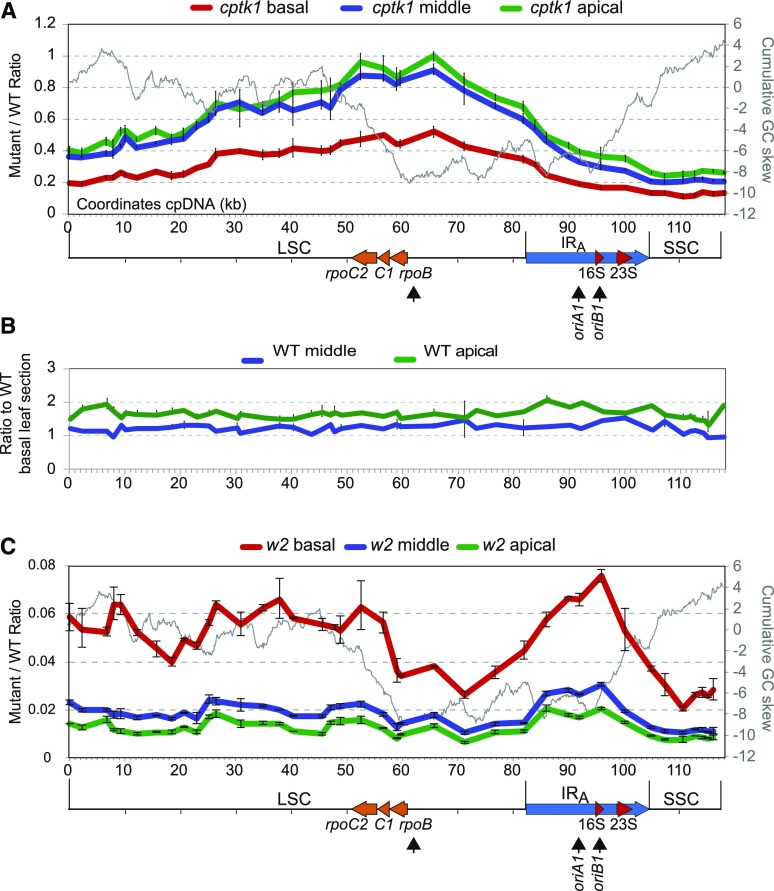
Figure 3.
Effect of cptk1 mutation on DNA abundance across the plastidial genome. A, Scanning of the cpDNA of cptk1 for changes in relative copy number of the different genome regions. Sequences along the cpDNA were quantified on the different leaf sectors defined in Supplemental Figure S6. Coordinates are those of the maize cpDNA sequence (accession NC_001666) with the LSC in reverse orientation, which seems to be the isomeric orientation of the genome consistent with the copy number gradient. The GC skew cumulative plot is superimposed as a gray line. The representation of the genome is shown below, with the position of the rRNA genes and of the rpoB, rpoC1, and rpoC2 genes marked. The position of the previously proposed origins of replication oriA and oriB are indicated, as well as the possible alternative replication origin active in cptk1 (arrow beneath rpoB). B, Comparison of position-dependent change in DNA copy number in middle and apical leaf sections as compared to the basal section in wild-type (WT) plants. Results showed no apparent stoichiometry changes, with variations across the genome in the range expected for technical errors. C, As in A for the w2-mum2 mutant deficient in the plastidial DNA polymerase (Udy et al., 2012). Values are the mean ± sd of technical triplicates.

