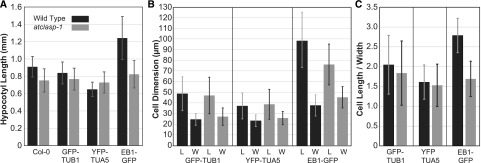
Figure 1.
The cell expansion phenotype of the atclasp-1 mutant is altered differently by different microtubule marker transgenes. A, Average hypocotyl lengths ± sd for 6-d-old, light-grown, wild-type and atclasp-1 seedlings in the Col-0, GFP-TUB1, YFP-TUA5, and EB1-GFP backgrounds. Differences between the wild type and atclasp-1 are significant in all backgrounds (P < 0.01 [n > 40 in all cases], Student’s t test used for all growth assays), and differences between all transgenic wild-type backgrounds and the Col-0 parent line are significant in all cases (P < 0.01). B, Mean cell length (L) and width (W) ± sd for fluorescent tubulin-expressing lines in the wild-type and atclasp-1 backgrounds (n = 14 plants, n > 530 cells for tubulin lines; n = 6 plants, n > 230 cells for EB1-GFP lines). Cell lengths between the wild type and the mutant in both fluorescent tubulin backgrounds are not statistically different (P > 0.05 in both cases), while the atclasp-1 cells are wider on average compared with the wild type in both backgrounds (P < 0.001). Cell lengths and widths are significantly different (P < 0.001) between the wild type and the mutant in the EB1-GFP background. C, Cellular anisotropy expressed as cell length divided by cell width ± sd for fluorescent tubulin-expressing lines.

