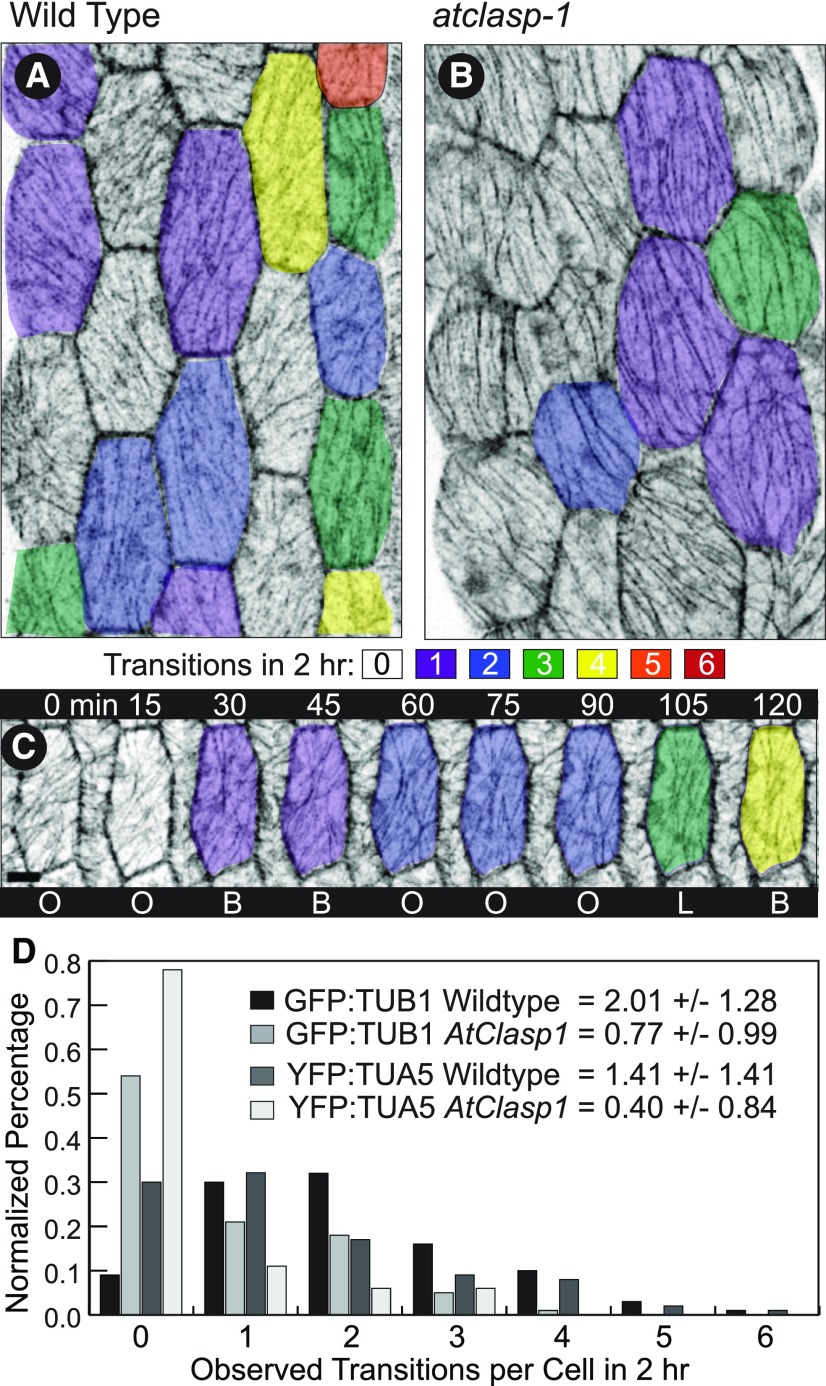
Figure 3.
Microtubule arrays transition between patterns less frequently in atclasp-1 cells. A and B, Hypocotyl cells from projected confocal image stacks displayed with inverted contrast showing the number of transitions between pattern types over a 2-h period for the wild type (A) and atclasp-1 (B). The color code is shown in the key, and images were taken at 15-min intervals. C, A single wild-type cell imaged at 15-min intervals with color coding showing four transitions over 120 min. D, Interleaved histograms of pattern transition frequencies for the wild type and atclasp-1 mutants in both GFP-TUB1 and YFP-TUA5 lines with the corresponding mean number of observed transitions ± sd per 120 min. B, basket; L, longitudinal; O, oblique.

