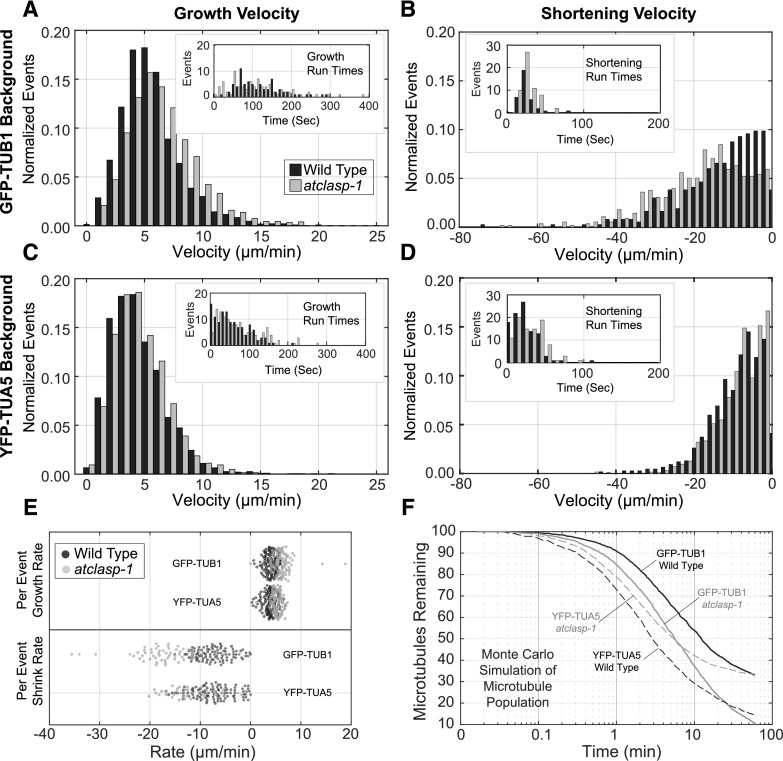
Figure 4.
Dynamic properties of the cortical microtubules in the wild-type and atclasp-1 mutant lines in GFP-TUB1 and YFP-TUA5 backgrounds. A to D, Interleaved histograms of growth and shortening velocities from wild-type and atclasp-1 cells (normalized for total counts) in the GFP-TUB1 (A and B) and YFP-TUA5 (C and D) backgrounds. Insets show distributions of observed growth run times (A and C) or shortening run times (B and D) used for the calculation of catastrophe and rescue frequencies, respectively. Tabular data are presented in Table 1. E, Distribution of growth and shortening velocities taken for each growth or shortening run for the wild type and mutant in GFP-TUB1 and YFP-TUA5 backgrounds. F, Monte Carlo simulation showing the loss of microtubules from an initial population of 100 (average of 25 trials for each curve) using mean microtubule dynamics parameters from wild-type and atclasp-1 plants in the GFP-TUB1 and YFP-TUA5 backgrounds. Time in log scale for a 60-min simulation was taken at 1-s intervals.

