Figure 5.
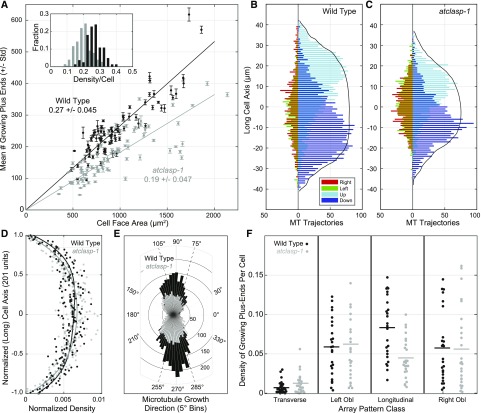
AtCLASP increases the density of longitudinally oriented microtubule plus ends across the cell face. A, Scatterplot relating the mean ± sd number of EB1-GFP foci per cell face (from five consecutive images) to cell face area for the wild type and atclasp-1 mutants. The inset histogram shows EB1-GFP comet densities per cell for wild-type and mutant lines. Trend lines represent mean density plotted from the origin (n > 80 cells). B and C, Interleaved histograms showing cumulative distributions of growing microtubule (MT) plus ends on the cell’s long axis by growth direction, taken in 90° quadrants (up, down, left, and right), for wild-type and atclasp-1 seedlings (n = 25/25 cells). Longitudinal directions are to the right of the ordinate and transverse directions to the left. Solid black lines indicate the scaled cumulative cell area as a function of the long axis. D, Spatial distribution of growing plus ends as a function of the normalized long axis (21 bins) scaled for total counts. Trend lines represent fourth-order polynomial fits to the wild-type and mutant data showing no obvious difference in the spatial distribution. E, Rose plot showing the number of microtubule trajectories per angle relative to the cell axis in the wild type and the mutant. F, Dot plots showing the density of EB1-GFP foci per cell for each of four defined microtubule orientations (i.e. transverse, 0°–15°/165°–180°; left oblique, 16°–74°; longitudinal, 75°–105°; and right oblique, 106°–164°). Data in B to F are from the same 25 cells for the wild type and the atclasp-1 mutant.

