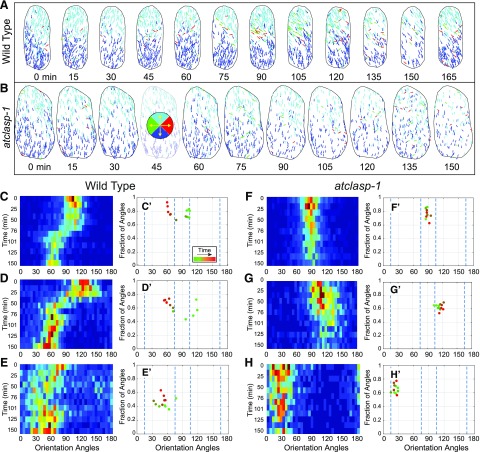
Figure 6.
Microtubule arrays in atclasp-1 show comparatively slow changes in array orientation and coalignment over time. A and B, Time-course analysis of a single wild-type (A) and atclasp-1 mutant (B) cell showing EB1-GFP trajectories color coded by growth direction at ∼15-min intervals over a 150-min period. The key in B shows the color coding trajectory. C to H, Histograms of microtubule orientation (1°–180°) taken at ∼15-min intervals determined from EB1-GFP growth trajectories plotted as heat maps with time running from top to bottom for three wild-type (C–E) and three atclasp-1 (F–H) cells starting in the same pattern. C′ to H′, Plots of the relative degree of array coalignment over the dominant microtubule orientation angle, color coded green to red for time, for the wild type (C′–E′) and atclasp-1 (F′–H′) using a ±21° window.

