Figure 7.
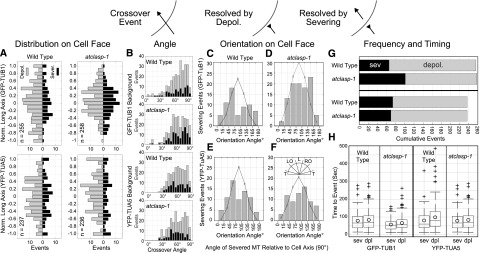
The atclasp-1 mutant shows background-dependent defects in microtubule severing at crossover sites. The schematic indicates microtubule crossover as a black arrow resolved through depolymerization (reversed arrow) or through severing at the crossover site. A, Spatial distribution of crossover events normalized to the cell’s long axis showing events resolved by depolymerization (gray, left of ordinate) and severing (black, right of ordinate) in GFP-TUB1 and YFP-TUA5 backgrounds for wild-type and atclasp-1 cells. B, Angle of microtubule crossover for all backgrounds in stacked histograms showing depolymerization (gray) and severing (black) events. C to F, Histograms showing the cumulative number of severing events for microtubules over a range of microtubule orientation angles relative to the long axis of the cell. Gray lines represent expected distributions of orientation angles estimated from EB1-GFP wild-type and mutant lines (Fig. 5) and scaled to the number of severing events in each histogram. The key in F gives the spatial orientation of histogram bins. G, Stacked bar graphs showing the fraction of crossover sites that were resolved by either severing (black) or depolymerization (gray) for wild-type and atclasp-1 mutant cells in GFP-TUB1 (n = 256/258) and YFP-TUA5 (n = 237/236) backgrounds. The difference between the wild type and the mutant in the GFP-TUB1 background is significant at P < 0.001 and not significant in the YFP-TUA5 background at P = 0.05 (Student’s t test). H, Box-and-whisker plots showing the amount of time in each crossover recorded prior to a severing or depolymerization event. Boxes represent quartiles, whiskers indicate ranges, and circles represent arithmetic means.

