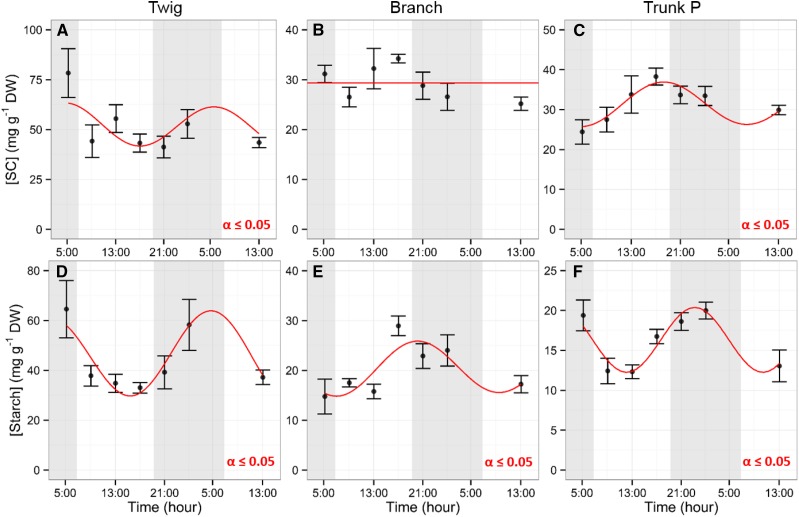
Figure 2.
Diurnal NSC trends in wood. Diurnal dynamics of SC (A–C) and starch (D–F) in wood of twig (A and D), branch (B and E), and trunk P (C and F) are shown. Samples were collected every 4 h. Data points represent mean values from five trees. Error bars represent se. Shaded areas represent nighttime. A significant effect of time of day was observed for each analysis except SC in branch (P ≤ 0.05, using a nonlinear mixed-effects model). Red lines represent mixed-effects model predictions. DW, Dry weight.

