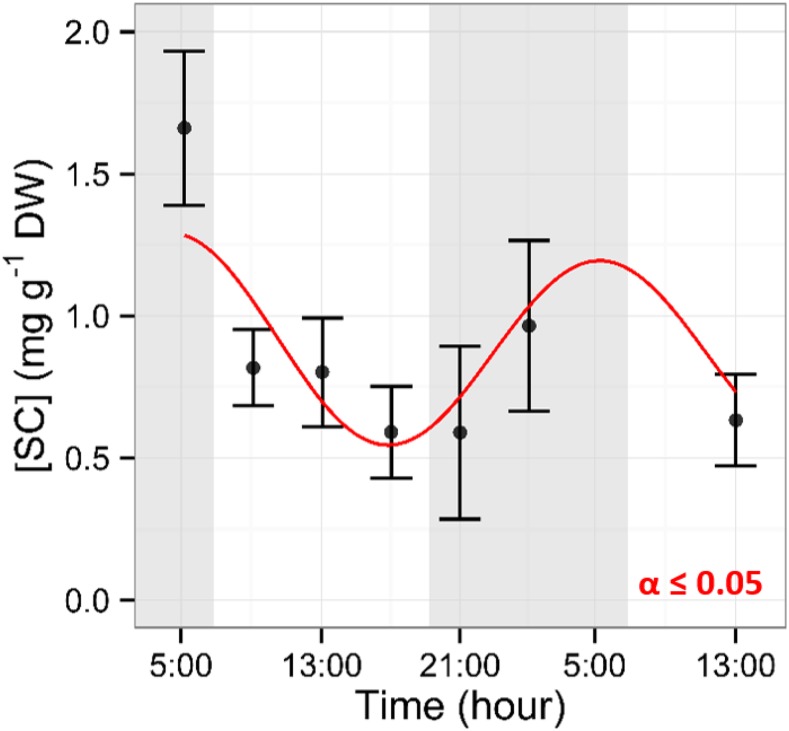
Figure 4.
Diurnal dynamics of SC in xylem sap. Samples were collected every 4 h. Shaded areas represent nighttime. Data points represent mean values from five trees. Error bars represent se. A significant effect of time of day was observed (P ≤ 0.05, using a nonlinear mixed-effects model). The red line represents the mixed-effects model predictions. DW, Dry weight.

