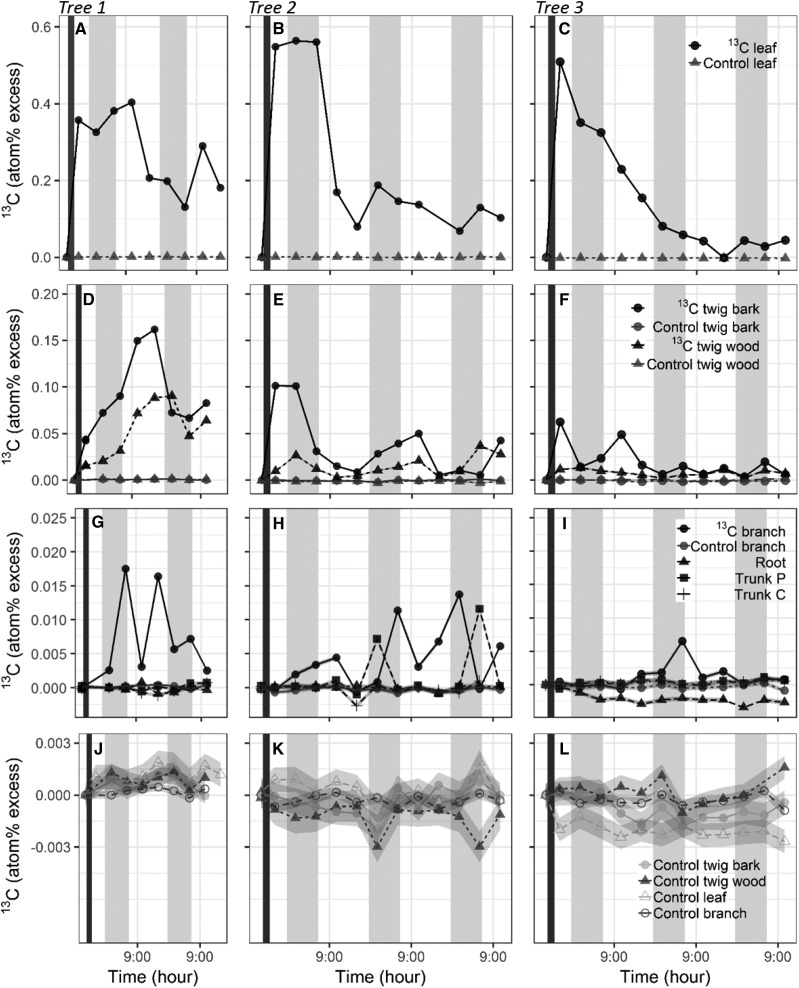
Figure 5.
Diurnal dynamics of NSC allocation in the overall architecture of the tree over 3 d. Pulse labeling of 13C was applied to a branch (branch 13C) for 2 h (dark vertical bars) in tree 1 (A, D, G, and J), tree 2 (B, E, H, and K), and tree 3 (C, F, I, and L). Levels of 13C were quantified in leaves (A–C), wood and bark of twigs (D–F), and wood at additional locations in the tree architecture, including trunk P and trunk C and in the roots (G–I). 13C atomic percent was compared with initial values to calculate APE. APE levels of the tissues from branch 13C (leaves, twig wood and bark, and branch wood; black symbols) were compared with natural variation in tissues from adjacent control branches (J–L; gray symbols in A–I). Gray ribbons around data points represent the sd for natural abundance (too small to show for the scale of A–I). 13C levels and variation observed in all of the branch tissues and in the trunk P exceeded natural variation. Shaded areas represent nighttime.

