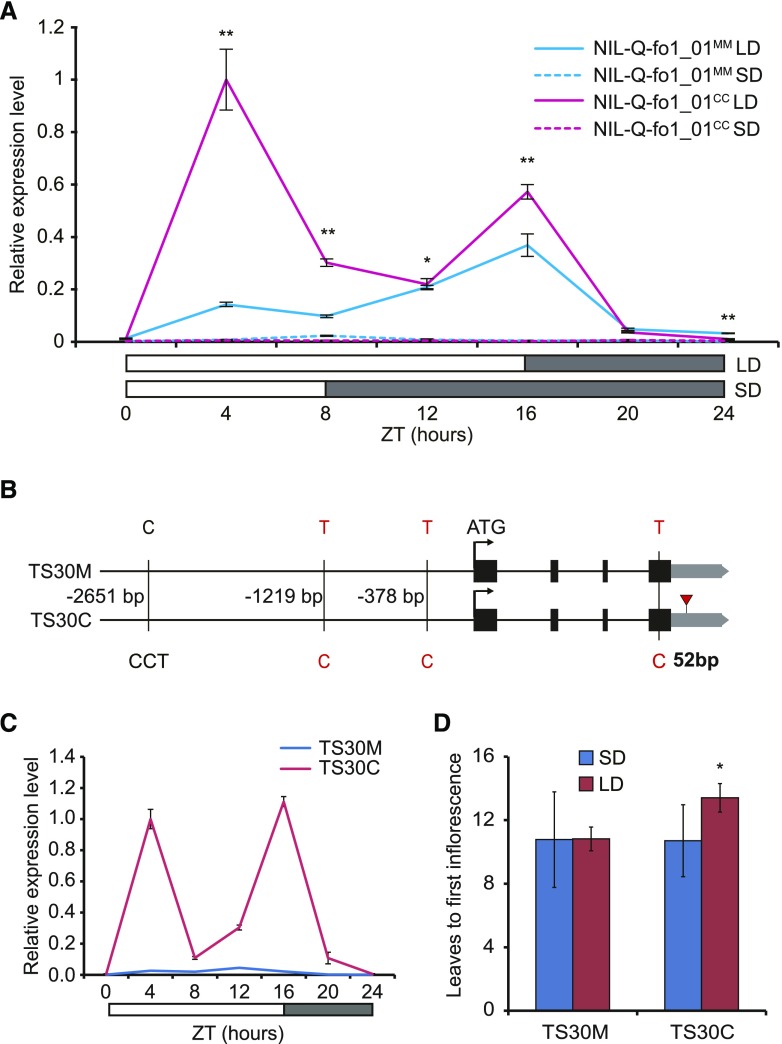
Figure 4.
SP5G expression is associated with polymorphisms between different alleles. A, Relative expression levels of SP5G over 24 h under LD (solid lines) or SD (dotted lines) conditions in 18-d-old seedlings of NIL-Q-fo1_01MM (cyan lines) and NIL-Q-fo1_01CC (magenta lines). The expression level of SP5G in NIL-Q-fo1_01CC at ZT4 under LD conditions was normalized as 1. Asterisks indicate statistically significant differences between NIL-Q-fo1_01MM and NIL-Q-fo1_01CC under LD: *, P < 0.05 and **, P < 0.01 (Student’s t test). B, Polymorphisms within the 3-kb promoter, coding sequence, and 3ʹ UTR of SP5G between TS30M and TS30C. The red triangle indicates the 52-bp sequence within the 3ʹ UTR. The polymorphisms in red indicate those that differed between the tomato groups exhibiting hypersensitivity and hyposensitivity to daylength. C, Relative expression levels of SP5G in 18-d-old seedlings of TS30M (cyan lines) and TS30C (magenta lines) under LD conditions. The expression level of SP5G in TS30C at ZT4 was normalized as 1. D, Flowering time of TS30M and TS30C under LD and SD conditions. Bars and lines indicate means and sd of more than six individual plants, and the asterisk indicates a statistically significant difference (P < 0.05, Student’s t test).

