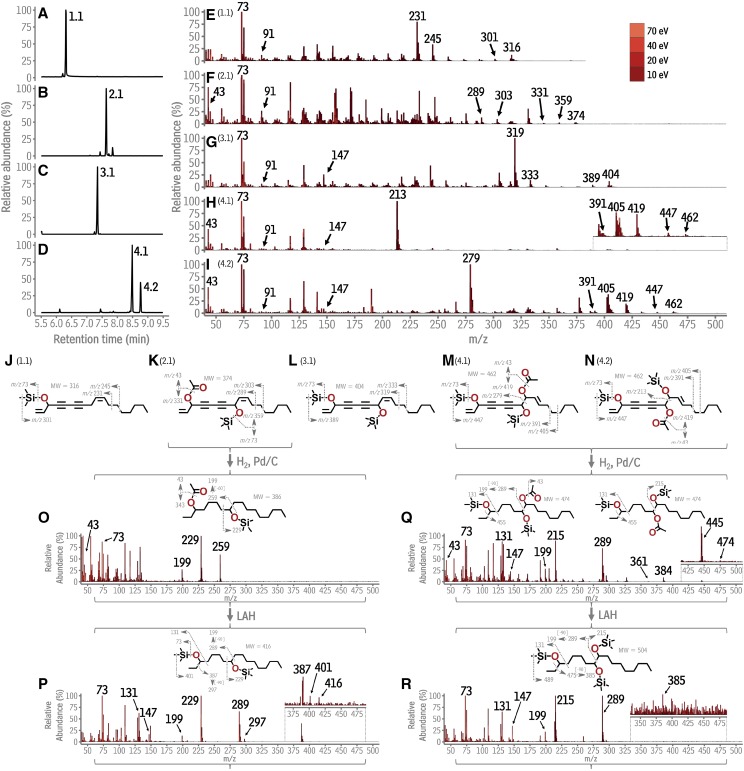
Figure 1.
Gas chromatographic-mass spectrometric identification of polyacetylenes from Daucus carota. A to D, Total ion chromatograms of putative polyacetylene-containing TLC fractions. Each peak is labeled with a number (1.1, 2.1, 3.1, 4.1, 4.2) that refers to its underlying compound. E to I, Composite mass spectra for each numbered compound (1.1–4.2), generated by overlaying the spectrum acquired for each compound at 70, 40, 20, and 10 eV. J to N, Structures of the numbered compounds and likely fragmentation mechanisms giving rise to their spectra in E to I. O to R, Spectrum, structure, and fragmentation of the product obtained from hydrogenation of compounds 2.1, 4.1 and 4.2, respectively. m/z, mass to charge ratio; Pd/C, palladium on carbon; LAH, lithium aluminum hydride; eV, electron volts.

