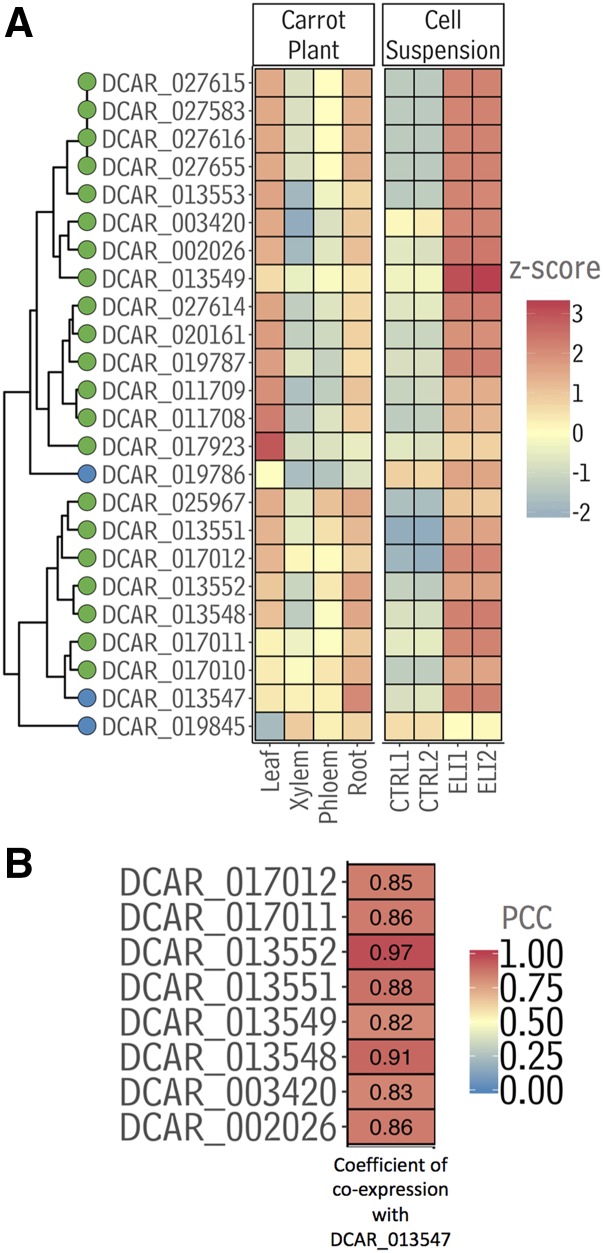
Figure 4.
Expression of FAD2s from carrot. A, Expression of carrot FAD2 genes (plotted as z-scores) in carrot leaves, xylem, phloem, and whole-root samples, as well as in carrot suspension cultures before (CTRL1 and 2, i.e. two replicates) and after (ELI1 and 2, i.e. two replicates) treatment with an elicitor extracted from mycelia of Phytopthora megasperma. The dendrogram connecting the gene names on the y axis was generated from ward. D2 clustering analysis of the z-scores presented in Supplemental Figure S5, not the heat map presented in A, which shows a subset of the full heat map presented in Supplemental Figure S5. Blue tip points denote putative Δ12 FAD2 desaturase genes and green tips denote putative divergent FAD2s as determined by the clustering in Fig. 3. B, Coexpression between DCAR_013547 and other carrot FAD2s with a Pearson correlation coefficients q < 0.1. Sequence data used in this figure can be found in the Phytozome/GenBank databases under the accession numbers listed in Supplemental Table S3.

