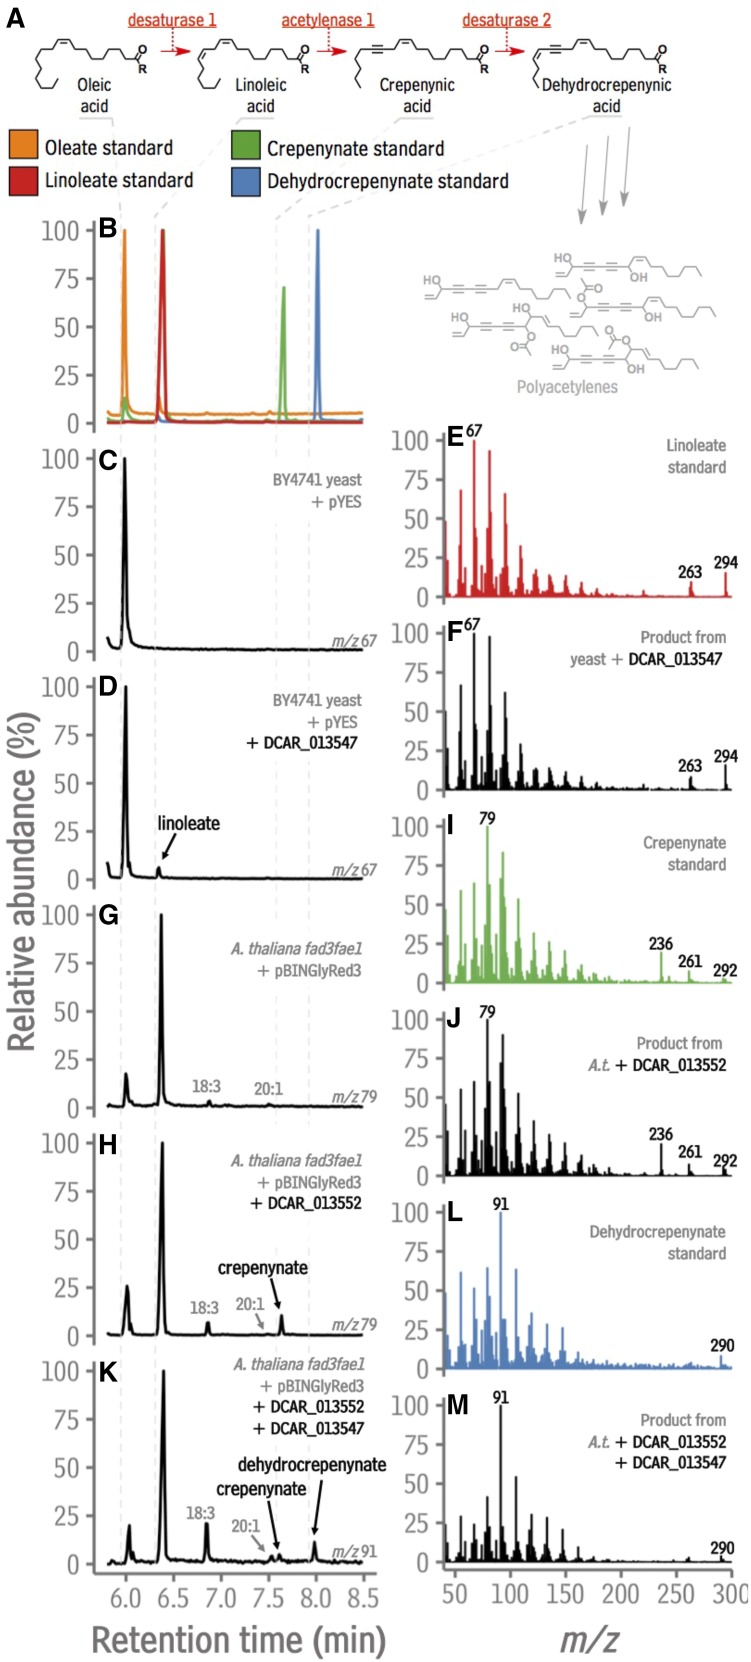
Figure 5.
Functional testing of candidate carrot desaturase and acetylenase enzymes by heterologous expression. A, Pathway to falcarin-type polyacetylenes. B, GC traces (ion abundance versus time) of oleate, linoleate, crepenynate, and dehydrocrepenynate standards. C, Single ion trace (m/z 67) of the fatty acid methyl esters from induced yeast strain BY4741 containing the pYES vector. D, Single ion trace (m/z 67) of the fatty acid methyl esters from induced yeast strain BY4741 containing the pYES vector harboring DCAR_013547. E, EI mass spectrum of the linoleate standard. F, EI mass spectrum of the indicated peak in D. G, Single ion trance (m/z 79) of fatty acid methyl esters from Arabidopsis fad3fae1 seeds transformed with an empty the pBINGlyRed3 vector. H, Single ion trance (m/z 79) of the fatty acid methyl esters from Arabidopsis fad3fae1 seeds transformed with the pBINGlyRed3 vector harboring DCAR_013552. I, EI mass spectrum of the crepenynate standard. J, EI mass spectrum of the indicated peak in H. K, Single ion trance (m/z 91) of the fatty acid methyl esters from Arabidopsis fad3fae1 seeds transformed with the pBINGlyRed3 vector harboring both DCAR_013547 and DCAR_013552. L, EI mass spectrum of the dehydrocrepenynate standard. M, EI mass spectrum of the indicated peak in K. m/z, mass to charge ratio. Sequence data used in this figure can be found in the Phytozome/GenBank databases under the accession numbers listed in Supplemental Table S3.

